


SMART TRADING DASHBOARD Study Guide
To access Tradingview Indicator for FREE Click Here
Part 1: Understanding the Foundation
The first lines of the script set up the basic parameters of the indicator.
• //version=5: This is crucial and specifies that the code is written for Pine Script version 5. TradingView updates its language, and version 5 has new features and syntax changes compared to previous versions.
• indicator(“SMART TRADING DASHBOARD”, overlay=true): This line defines the script as an indicator and gives it a name, “SMART TRADING DASHBOARD.” The overlay=true parameter tells Pine Script to draw the indicator directly on the price chart, not in a separate panel below it.
Part 2: Defining Inputs and Variables
The //━━━━━━━━━━━━━ INPUT PARAMETERS ━━━━━━━━━━━━━ section is where the user can customize the indicator without changing the code.
• input.int() and input.float(): These functions create configurable settings for the indicator, such as the Supertrend’s ATR period, ATR multiplier, risk percentage, and target percentages. The user can change these values in the indicator’s “Settings” menu.
• input.string() and input.bool(): These are used for inputs that are not numerical, such as the position of the dashboard table and a toggle to show/hide it.
This section also initializes several variables using the var keyword. var is a special keyword in Pine Script that declares a variable and ensures its value is preserved from one bar to the next. This is essential for tracking things like the entry price, stop-loss, and profit targets.
Part 3: The Core Trading Logic
Supertrend Analysis
The Supertrend is a trend-following indicator.
• [supertrend, dir] = ta.supertrend(factor, atrPeriod): This line uses a built-in Pine Script function, ta.supertrend(), to calculate the Supertrend line. It returns two values: the supertrend line itself and a dir (direction) value which is 1 for an uptrend and -1 for a downtrend.
• buySignal = ta.crossover(close, supertrend): This detects a buy signal when the closing price crosses over the Supertrend line.
• sellSignal = ta.crossunder(close, supertrend): This detects a sell signal when the closing price crosses under the Supertrend line.
Entry, Take-Profit (TP), and Stop-Loss (SL) Calculations
The if statements check for the buySignal and sellSignal conditions.
• if buySignal: When a buy signal occurs, the script sets the entry price to the current close, and calculates the sl, tp1, tp2, and tp3 based on the predefined percentage inputs. The signalType is set to “LONG.”
• if sellSignal: Similarly, for a sell signal, it calculates the levels for a “SHORT” trade.
This section is vital as it provides the core trading levels to the user.
Part 4: Additional Market Analysis
This script goes beyond a simple Supertrend and includes several other analysis tools.
• Volume Analysis: The code calculates a volume moving average (volMA) and a volRatio to see if the current volume is high compared to its recent average.
• Profit % and Risk-to-Reward (RR): It continuously calculates the floating profit/loss percentage of the current position and the risk-to-reward ratio based on the entry and third target. This provides real-time performance metrics.
• PCR & OI Trend (Simulated): The script simulates PCR (Put/Call Ratio) and OI (Open Interest) trends. It uses request.security() to get data from a higher timeframe (60-minute) and compares the simulated values to determine if the market is in a “Long Buildup,” “Short Covering,” or other states. This adds a simulated derivative market analysis to the tool.
• Momentum Analysis: It uses the built-in ta.rsi() function to calculate the Relative Strength Index (RSI) and determines if the market is overbought or oversold to identify momentum.
• PDC Analysis: “PDC” stands for Previous Day Close. The script checks if the current close is above the previous day’s high or below the previous day’s low to determine a daily breakout bias.
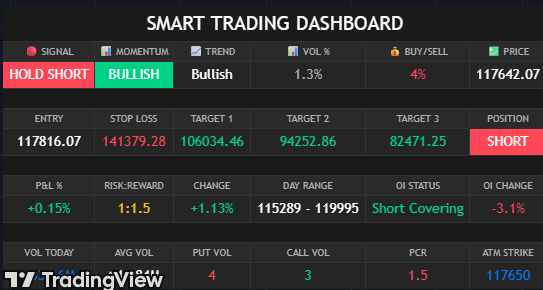
Part 5: Creating the Visual Dashboard
The dashboard is built using Pine Script’s table functions.
• Color Scheme: The code defines a professional, dark theme color scheme using hexadecimal color codes. These colors are then used throughout the table to provide a clear and organized display.
• table.new(): This function creates the table object itself, defining its position (positionOpt input), columns, and rows.
• table.cell(): This is used to populate each individual cell of the table with text, background color, and text color. The script uses table.merge_cells() to combine cells for a cleaner, more readable layout.
• str.tostring(): This function is used to convert numerical values (like entry, sl, profitPct) into string format so they can be displayed in the table.
• plot(): Finally, the plot() function draws the Supertrend line on the chart itself, with the line color changing based on the trend direction (dir).
Part 6: Alerts
The alertcondition() function creates custom alerts that the user can set up in the TradingView platform.
• alertcondition(buySignal, …): This creates a “Buy Signal” alert. The message parameter is the text that will appear when the alert is triggered.
• alertcondition(sellSignal, …): Creates a “Sell Signal” alert.
• alertcondition(volRatio > 2, …): This is a great example of a custom alert, triggering when a significant volume spike is detected.
________________________________________
aiTrendview Disclaimer
Trading financial markets, including futures, options, and stocks, involves substantial risk of loss and is not suitable for every investor. The “SMART TRADING DASHBOARD” is a technical analysis tool for educational and informational purposes only. It is not financial advice. The indicator’s signals and metrics are based on historical data and simulated logic, and past performance is not indicative of future results. You should not treat any signals or information from this tool as a definitive guide for making trades. Always conduct your own research, and consider consulting with a qualified financial professional before making any investment decisions. The creator and provider of this script are not responsible for any trading losses you may incur.


