

RSI Over Bought & Over Sold Zone Analiser. Free Tradingview Indicator, Life Time Free Pine Script Access
To access Tradingview Indicator for FREE Click Here
RSI OB/OS Trading System: Study Material
Overview
This Pine Script implements an advanced artificial intelligence-enhanced Relative Strength Index (RSI) trading system that combines traditional technical analysis with machine learning concepts to generate more accurate trading signals.
Core AI Concepts
Feature Engineering
The system creates multiple technical indicators as “features” that feed into the AI model. These include logarithmic returns (price momentum), traditional RSI values, Average True Range percentage (volatility measure), and volume-based metrics. Each feature captures different aspects of market behavior – price movement, momentum, volatility, and trading activity. The system uses prior bar values to predict future RSI movements, creating a time-lagged relationship between inputs and outputs.
Machine Learning Pipeline
The AI component follows a standard machine learning workflow. It defines a target variable (what we want to predict) – the previous bar’s RSI value. The predictors are lagged versions of all technical features. The system then applies correlation analysis to identify which features have the strongest relationship with the target, essentially performing automated feature selection.
Correlation-Based Feature Selection
Rather than using all available features, the system calculates correlation coefficients between each predictor and the target RSI. It then ranks features by their absolute correlation strength and selects the top-performing ones. This reduces noise and focuses the model on the most predictive indicators, improving signal quality and reducing overfitting.
Standardization and Z-Scoring
All features undergo z-score normalization, converting them to standard deviations from their rolling means. This process ensures that features with different scales (price vs volume) can be compared fairly. Standardization also makes the model more robust to changing market conditions and prevents any single feature from dominating the prediction due to scale differences.
Prediction Mechanism
The system creates predictions by combining standardized features with their corresponding correlation coefficients as weights. This weighted sum approach mimics linear regression but uses correlation as the weighting mechanism. The prediction is then transformed back from z-score space to actual RSI levels using rolling statistics.
Technical Analysis Components
RSI Enhancement
Traditional RSI is enhanced through the AI prediction system. Instead of relying solely on current RSI readings, the system predicts where RSI should be based on multiple market factors. This predicted RSI is then converted into a “weight” that ranges from -2 to +2, creating a more nuanced signal than simple overbought/oversold levels.
Signal Generation Logic
Buy signals trigger when the AI-weighted RSI signal line crosses above -0.5 from below, indicating the system predicts upward momentum. Sell signals occur when the line crosses below +0.5 from above, suggesting potential downward movement. These thresholds are more conservative than traditional RSI levels, aiming to reduce false signals.
Volume Analysis Integration
The system incorporates sophisticated volume analysis by separating buying and selling pressure. It calculates buy volume percentage (volume on up-close bars) and sell volume percentage (volume on down-close bars). Volume pressure combines these metrics to show overall market sentiment, with positive values indicating buying pressure and negative values showing selling dominance.
Performance Tracking
Signal Tracking System
The system maintains state variables to track the current signal direction (bull, bear, or neutral) and monitors the maximum points gained since each signal was generated. This allows traders to assess the effectiveness of each signal and understand the potential profit from following the system’s recommendations.
VWAP Integration
Volume Weighted Average Price (VWAP) serves as an additional reference point, showing whether the current price is above or below the average price weighted by volume. The system calculates the difference between current price and VWAP, providing context for trade entries and exits.
Dashboard Analytics
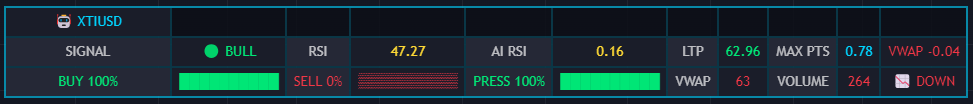
Real-Time Metrics Display
The dashboard presents all key metrics in a professional layout, showing signal status, traditional RSI, AI-enhanced RSI, current price, maximum points from last signal, VWAP data, and volume analysis. This comprehensive view allows traders to quickly assess market conditions and make informed decisions.
Visual Progress Indicators
Volume metrics include progress bar visualizations that show the proportion of buying versus selling activity. These visual elements make it easier to quickly assess market sentiment and volume pressure without parsing numerical data.
Learning Applications
For Quantitative Analysis Students
This system demonstrates practical applications of correlation analysis, standardization techniques, and feature selection in financial markets. Students can study how mathematical concepts translate into trading strategies and understand the importance of data preprocessing in predictive modeling.
For Technical Analysis Learners
The script shows how traditional indicators can be enhanced through quantitative methods. It demonstrates the evolution from simple RSI signals to multi-factor predictive models, illustrating how modern trading systems combine classical technical analysis with contemporary data science approaches.
For Pine Script Developers
The code structure demonstrates advanced Pine Script techniques including table creation, dynamic positioning, state management, and complex conditional logic. It shows how to build professional-grade trading tools with comprehensive user interfaces and real-time data processing.
Key Learning Takeaways
Integration of Multiple Timeframes
The system shows how to combine different aspects of market data (price, volume, volatility) into a cohesive predictive framework. This multi-dimensional approach is more robust than single-indicator systems and provides a template for developing sophisticated trading strategies.
Adaptive Market Analysis
Through rolling window calculations and correlation-based feature selection, the system adapts to changing market conditions. This dynamic approach contrasts with static trading rules and demonstrates the importance of adaptive systems in modern trading.
Risk Management Concepts
By tracking maximum points and providing comprehensive market context through the dashboard, the system emphasizes the importance of performance monitoring and situational awareness in trading decisions. This holistic view supports better risk management and trade timing decisions.
Disclaimer
Training & Educational Only — This material and the RSI OB/OS indicator are provided for educational purposes only. Nothing here is investment advice or a solicitation to buy or sell financial instruments. Past simulated or historical performance does not predict future results. Always perform full back testing and risk management, and consider seeking advice from a qualified financial professional before trading with real capital.
________________________________________


