

Quantum Trading Matrix Study Material
To access Tradingview Indicator for FREE Click Here
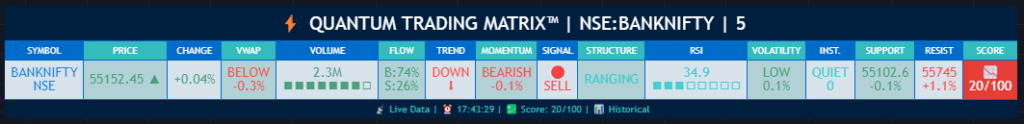
The Quantum Trading Matrix is a sophisticated Pine Script indicator designed for TradingView that offers a comprehensive trading dashboard by combining multiple market analysis techniques in one interface. The indicator integrates price action, volume, momentum, trend detection, institutional activity, and technical oscillators to provide traders a unified perspective on the market.
At its core, the script uses fundamental market data like price (open, high, low, close) and volume to calculate various metrics. The VWAP (Volume Weighted Average Price) is a key element that helps traders understand if the price is trading above or below the average price weighted by volume, indicating market strength or weakness. The distance of the current price from the VWAP is computed as a percentage to signal how far the price has diverged from this benchmark.
Momentum is measured through a “Quantum Momentum Oscillator” derived from the difference between fast and slow exponential moving averages of price. Positive momentum signals bullish conditions while negative momentum signals bearish ones. Volume flow analysis breaks down buying versus selling pressure on each bar by observing where the close price lies within the daily range combined with volume, generating an order flow ratio. This aids in identifying if buyers or sellers dominate the market at a given time.
Trend detection involves calculating EMAs of different lengths (8, 21, and 50) and aggregating their relationships into a trend score. Scores range from strong uptrend to downtrend, providing a clear directional bias. Institutional activity is inferred by detecting volume spikes significantly above the average volume, suggesting large players might be active. A dark pool estimate provides an approximate volume figure representing hidden or off-exchange trading.
The script also identifies market structure by detecting pivot highs and lows which act as resistance and support levels, respectively. These levels offer valuable insight into potential price reversals or breakouts. The RSI (Relative Strength Index) is incorporated, including a basic divergence detection to suggest potential bull or bear reversals. Volatility is measured using the Average True Range (ATR), classifying the current volatility from low to extreme, helping traders gauge the risk environment.
All these metrics are combined into a scoring system that awards points for positive indications such as price above VWAP, positive order flow, bullish momentum, and an uptrend in EMAs. The overall score ranges from 0 to 100 and is interpreted visually with emojis: a rocket for strong bullish setups, a chart up emoji for positive bias, a balanced scale for neutral, and a chart down emoji for bearish conditions.
The indicator issues alerts based on the combination of these signals, including bullish and bearish setups when multiple criteria align favorably, volume spike alerts when abnormal volume events occur, and institutional activity alerts for high volume surges.
To use this indicator effectively, traders should first assess the trend direction indicated by the EMA-based scoring. Positive momentum and price trading above the VWAP confirm bullish bias, while the opposite suggests bearishness. Volume flow and institutional activity provide additional confirmation. Support and resistance levels derived from pivots help in planning entries and exits. The RSI and volatility readings inform traders of potential overbought or oversold conditions and market risk levels. Alerts provide timely notifications to act on significant setups.
The indicator is highly customizable, allowing users to adjust the dashboard’s position, size, and color theme to suit personal preferences. Parameters such as the momentum period, volume profile bars, trend multiplier, and signal sensitivity can be fine-tuned to adapt to different markets and trading styles.
This tool requires foundational knowledge of key technical concepts such as EMAs, VWAP, ATR, RSI, and volume analysis for best utilization. For traders interested in expanding their understanding, recommended resources include the TradingView Pine Script manual, technical analysis books by John J. Murphy and Dr. Alexander Elder, and practical video tutorials focusing on volume spread analysis and institutional order flow.
Overall, the Quantum Trading Matrix™ serves as a powerful control panel for active traders, providing a multi-dimensional view of the market through combined technical indicators, helping to identify high probability trade setups and manage risk effectively.
________________________________________
⚠️ Warning:
• Trading financial markets involves substantial risk.
• You can lose more money than you invest.
• Past performance of indicators does not guarantee future results.
• This script must not be copied, resold, or republished without authorization from aiTrendview.
By using this material or the code, you agree to take full responsibility for your trading decisions and acknowledge that this is not financial advice.
________________________________________
⚠️ Disclaimer and Warning (From aiTrendview)
This Dynamic Trading Dashboard is created strictly for educational and research purposes on the TradingView platform. It does not provide financial advice, buy/sell recommendations, or guaranteed returns. Any use of this tool in live trading is completely at the user’s own risk. Markets are inherently risky; losses can exceed initial investment.
The intellectual property of this script and its methodology belongs to aiTrendview. Unauthorized reproduction, modification, or redistribution of this code is strictly prohibited. By using this study material or the script, you acknowledge personal responsibility for any trading outcomes. Always consult professional financial advisors before making investment decisions.


