


QUANTUM MARKET ANALYZER X7 — Study Material (Learning & Teaching Guide)
To access Tradingview Indicator for FREE Click Here
What this tool is (and isn’t)
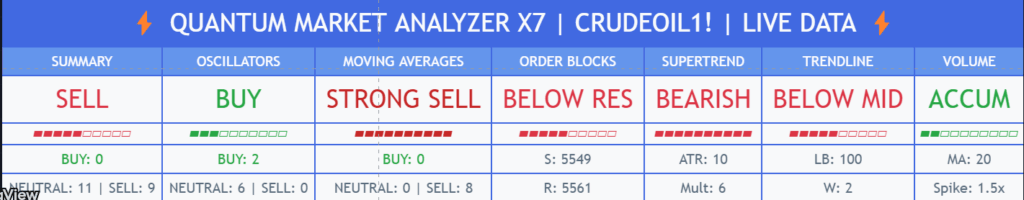
QUANTUM MARKET ANALYZER X7 is a multi-factor TradingView indicator that summarizes many classic signals into one dashboard. It does not predict the future or guarantee profits. It simply scores what is happening now using oscillators, moving averages, order-block behavior, trendline/channel context, Supertrend bias, and volume/flow clues—so you can make structured, risk-aware decisions.
________________________________________
Quick start (for brand-new traders)
1. Add the indicator to a chart.
2. Pick an Analysis Timeframe (e.g., 60-min for day trading, 4-hour for swing).
3. Read the Summary tile first; then check Oscillators → MAs → OB/Trendline/Supertrend → Volume.
4. Take trades only when multiple sections agree, and always plan stop loss and size before entry.
________________________________________
How the dashboard is built (section by section)
Below you’ll learn what each section measures, how the numbers are produced, and how to interpret them. The script converts each sub-signal into a small integer (e.g., +2, +1, 0, −1, −2). These are summed into section totals and then into a Summary score.
1) Summary (the combined score)
• What it is: The grand total of all sections (Oscillators + Moving Averages + Advanced: OB, Trendline/Channel, Supertrend, Volume).
• How it’s labeled:
o Large positive total → BUY / STRONG BUY
o Around zero → NEUTRAL
o Large negative total → SELL / STRONG SELL
• How to use: Treat it as a headline, not a trigger. Confirm with the sections below and price action.
________________________________________
2) Oscillators (momentum / overbought–oversold)
Inputs used on your chosen timeframe:
• RSI(14):
o 70 → bearish pressure (−)
o <30 → bullish pressure (+)
• Stochastic (14):
o 80 overbought (−), <20 oversold (+)
• CCI(20):
o +100 (−), <−100 (+)
• Williams %R(14):
o −20 overbought (−), <−80 oversold (+)
• MACD(12,26,9):
o MACD line > Signal → (+), below → (−)
• Momentum(10): >0 → (+), <0 → (−)
• ROC(9): >+2% → (+), <−2% → (−)
• Bollinger Bands(20,2):
o Price > Upper band → (−), < Lower band → (+)
How it scores: Each item contributes between −2 and +2 (or −1/+1 for some). The Oscillator total is their sum.
How to use: Oscillators excel for timing. Favor longs when the total is clearly positive and exiting or avoiding when clearly negative.
________________________________________
3) Moving Averages (trend/structure)
MAs used: SMA(10/20/50/100/200) and EMA(10/20/50).
Scoring logic: Compares price vs each MA:
• Price > MA by >2% → +2 (strongly bullish)
• Price > MA by 0–2% → +1
• Price < MA by 0–2% → −1
• Price < MA by >2% → −2
How to use: A clearly positive MA total suggests trend alignment for longs; clearly negative favors shorts or flat. Mixed readings → treat as range/transition.
________________________________________
4) Order-Block (OB) breakout analysis (support/resistance from clustered reactions)
What it approximates: The script searches a lookback window for pivot-like candles and counts repeated “touches” near that level (within ±0.2%) to infer support (bullish OB) or resistance (bearish OB).
Settings you can tune
• OB Lookback Period: how far back to search.
• Min OB Touches: more touches = stronger level.
Signals produced
• BULLISH BRK: Price crosses above the most recent bearish OB (resistance → breakout).
• BEARISH BRK: Price crosses below the most recent bullish OB (support → breakdown).
• ABOVE SUP / BELOW RES: Price position relative to the latest OB levels.
How to use: Use OB with MAs and Volume. Best when a breakout comes with trend alignment and volume expansion.
________________________________________
5) Trendline / Channel analysis (context envelope)
Rather than a single diagonal line, this module forms a dynamic channel:
• Finds highest high and lowest low over your Trendline Lookback.
• Builds a midline = (highest + lowest)/2.
• Creates an upper/lower channel by multiplying the range with Channel Width Multiplier.
Signals produced
• UPPER BRK: Price > upper channel (bullish expansion)
• LOWER BRK: Price < lower channel (bearish expansion)
• ABOVE MID / BELOW MID: Bias zone inside channel
How to use: Treat UPPER/LOWER breaks as momentum context. Confirm with MAs and Volume before acting.
________________________________________
6) Supertrend (ATR-based bias)
• Uses ta.supertrend(ATR Multiplier, ATR Period) on your analysis timeframe.
• Signal:
o BULLISH when Supertrend flips to trend-up state
o BEARISH when it flips to trend-down
Tuning tips:
• Higher ATR Multiplier (e.g., 6) → fewer, higher-quality flips.
• Lower multiplier → more responsive, more noise.
How to use: Use Supertrend as a trend filter. Avoid fighting it unless higher-timeframe context disagrees and you have strong confluence.
________________________________________
7) Volume/Flow analysis (participation & pressure)
This section combines several volume-based tools:
1. Volume Spike vs MA
o Volume MA Period (default 20)
o Volume Spike Threshold (e.g., 1.5×)
o If current volume / MA > threshold → spike.
2. OBV vs OBV-MA → Accumulation (+) / Distribution (−)
3. VPT vs VPT-MA → Price-volume trend alignment (+/−)
4. MFI(14): >70 (−), <30 (+)
5. Accumulation/Distribution vs its MA → (+/−)
Scoring:
• Big spike with up bar → +2; with down bar → −2
• Each of OBV, VPT, MFI, A/D adds +1 or −1
Interpretation labels:
• HIGH ACC / ACCUM → constructive flow
• HIGH DIST / DISTRIB → selling pressure
• NEUTRAL → no edge
How to use: Favor setups where directional signals + trend + volume point the same way.
________________________________________
Putting it together — a repeatable reading order
1. Summary: What’s the combined bias?
2. Oscillators: Is momentum supportive or stretched?
3. MAs: Is price aligned with the trend structure?
4. OB & Trendline/Channel: Are we breaking key levels/zones?
5. Supertrend: Is the higher-level bias with you or against you?
6. Volume: Is there participation to confirm the move?
Only act when at least 3–4 sections agree and you can define a logical stop and position size.
________________________________________
Parameter tuning (step-by-step)
1. Choose timeframe:
o 15–60m for active trading; 4h–1D for swing.
2. Oscillators:
o Keep defaults first; later tighten or loosen thresholds only if you’ve tested.
3. Moving Averages:
o The script’s built-in 0–2% bands around each MA are sensible.
o If your market is very volatile, you can consider widening the 2% threshold to reduce whipsaws (requires code edit).
4. Order Blocks:
o Start with OB Lookback ~50 and Min Touches = 2.
o Increase touches for fewer, stronger zones.
5. Trendline/Channel:
o Longer Trendline Lookback and smaller Channel Width → tighter channel (more breaks).
o Shorter lookback and larger width → fewer breaks.
6. Supertrend:
o If you get too many flips, raise ATR Multiplier.
o If it’s lagging, lower it slightly.
7. Volume:
o For quieter instruments, reduce the Threshold (e.g., 1.2×).
o For very liquid/active markets, 1.5–2.0× works well.
________________________________________
Example playbooks (for practice)
A) Pro-trend long continuation
• Summary: BUY or STRONG BUY
• MAs: clearly positive
• Supertrend: BULLISH
• OB/Trendline: ABOVE MID or UPPER BRK
• Volume: ACCUM or HIGH ACC
Plan: Enter on a minor pullback; stop below recent structure; scale out at logical resistance.
B) Mean-reversion short (cautious)
• Oscillators: multiple overbought readings (RSI>70, price > BB upper)
• MAs: still positive (trend up), so this is countertrend
• Volume: no spike
Plan: If you must, take smaller size, tighter stop, faster targets. Prefer waiting for alignment instead.
C) Breakout with confirmation
• OB: BULLISH BRK of a known resistance
• Trendline/Channel: UPPER BRK
• Volume: spike with up bar
• Supertrend: recently flipped up
Plan: Enter on retest or structured continuation; define stop under breakout level.
________________________________________
Common pitfalls to avoid
• Acting on one section alone. Confluence matters.
• Chasing after long candles without volume follow-through.
• Ignoring timeframe alignment. Check the next higher timeframe.
• Oversizing trades just because “Summary = Strong Buy/Sell.”
• Moving stops farther instead of accepting a planned loss.
________________________________________
Practice & evaluation routine
1. Replay mode (TradingView Bar Replay) to practice reading the tiles in order.
2. Journal each trade: which sections agreed, where stop/target were, outcome.
3. Weekly review: Were losing trades missing confirmation? Did you respect size rules?
4. Iterate cautiously: Change one setting at a time and observe for a week.
________________________________________
Frequently asked questions
Q: Is the Summary score weighted?
A: Each sub-signal contributes small integers; totals from Oscillators, MAs, and Advanced sections are added without fancy weighting, keeping it transparent.
Q: Can I use this as a standalone system?
A: It’s best used as a decision support layer with your own risk rules, not as a mechanical “buy/sell” machine.
Q: Which timeframe is best?
A: The one that matches your holding period. Always confirm with at least one higher timeframe.
________________________________________
Suggested classroom flow (for teaching)
1. Session 1: Oscillators only → identify good vs stretched momentum.
2. Session 2: Moving Averages → trend structure and bias.
3. Session 3: OB + Trendline/Channel → location and breakouts.
4. Session 4: Supertrend + Volume → confirmation and participation.
5. Session 5: Confluence building → case studies and journaling.
6. Session 6: Risk management, sizing, and review habits.
________________________________________
Disclaimer aiTrendview (please read)
This indicator and study material are provided for educational and research purposes only. They do not constitute financial advice, investment recommendations, or a promise of performance. Trading involves substantial risk and may result in losses. Past performance of any method or indicator does not guarantee future results. You are solely responsible for your trading decisions, including risk management, position sizing, and due diligence. Always test ideas in a demo environment before using real capital, and consider consulting a licensed financial advisor.


