Study Material: Inside Candle Divergence Indicator (aiTrendview)
To access Tradingview Indicator for FREE Click Here
1. Introduction
The Inside Candle Divergence Indicator is a custom tool built on TradingView using Pine Script. It is designed to help traders identify potential reversal points or trend continuations using a mix of candlestick analysis, RSI (Relative Strength Index), VWAP (Volume Weighted Average Price), Pivot Points, and Volume analytics. The tool also provides a dashboard table on the chart, summarizing all key values in a single glance for traders and analysts.
This indicator is not just a signal generator but also an educational framework—explaining how different concepts in technical analysis combine to build a systematic approach for market entries and exits.
________________________________________
2. Core Concepts Behind the Tool
A. Inside Candle Pattern
An Inside Candle forms when the current candle’s high is lower than or equal to the previous candle’s high, and the low is higher than or equal to the previous candle’s low.
• This means the entire price action of the current candle is “inside” the range of the previous candle.
• A bullish inside candle occurs when the close is higher than the open.
• A bearish inside candle occurs when the close is lower than the open.
This pattern shows market indecision but also sets up potential breakouts or trend reversals.
________________________________________
B. RSI (Relative Strength Index)
The indicator calculates RSI using the formula from the ta.rsi() function in TradingView. RSI helps measure momentum in the market.
• A low RSI (below 25) signals an oversold zone → possible buy.
• A high RSI (above 75) signals an overbought zone → possible sell.
By combining RSI with the Inside Candle, the indicator ensures that signals are triggered only when momentum and price patterns confirm each other.
________________________________________
C. Buy & Sell Signals
• Buy Signal: Triggered when RSI < Buy Level (default 25) and a bullish inside candle forms.
• Sell Signal: Triggered when RSI > Sell Level (default 75) and a bearish inside candle forms.
When triggered, the chart displays a BUY (green label below candle) or SELL (red label above candle) marker. The indicator also saves the entry price and signal bar for future reference inside the dashboard.
________________________________________
D. VWAP (Volume Weighted Average Price)
VWAP is calculated using the typical price (H+L+C)/3 and weighting it by volume.
• VWAP shows the average trading price weighted by volume, widely used by institutions.
• The tool calculates the distance of price from VWAP in % terms.
• If price is far above VWAP, the market may be overheated (overbought). If far below, it may be undervalued (oversold).
________________________________________
E. Volume Analysis
The tool splits volume into Buy Volume and Sell Volume:
• Buy Volume: If close > open.
• Sell Volume: If close ≤ open.
• Cumulative totals are maintained, and percentages are calculated to show what proportion of total market volume is bullish vs bearish.
• A progress bar style visual (using blocks █) shows the dominance of buyers or sellers.
This allows traders to quickly measure whether buyers or sellers are controlling the market trend.
________________________________________
F. Daily Pivot Points
Pivot Points are calculated using the previous day’s high, low, and close:
• Pivot = (High + Low + Close) / 3
• R1, S1, R2, S2, R3, S3 levels are derived from this pivot.
• These levels act as support and resistance zones.
The script plots Pivot, R1, and S1 lines on the chart for easy reference.
________________________________________
G. Trend Direction
The indicator checks where the price is compared to R1 and S1:
• If price > R1 → Bullish Trend
• If price < S1 → Bearish Trend
• Otherwise → Neutral Trend
The trend direction is displayed in the dashboard with arrows (↑, ↓, →).
________________________________________
H. Price Change Calculation
The tool calculates:
• Price Change = Current Close – Previous Close
• Percentage Change = (Change / Previous Close) × 100
• Displays ▲ (green upward) or ▼ (red downward) with the exact percentage.
This gives traders a quick snapshot of intraday price movement.
________________________________________
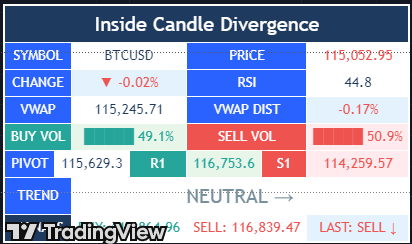
I. Dashboard Table
One of the most powerful features is the real-time dashboard table shown on the chart. It contains:
1. Symbol & Price Info (Current ticker, price, change %)
2. RSI Reading (with color coding: green for oversold, red for overbought)
3. VWAP and Distance from VWAP
4. Volume Analysis with Progress Bar (Buy vs Sell %)
5. Pivot Levels (Pivot, R1, S1)
6. Trend Direction (Bullish, Bearish, Neutral)
7. Signal Status (Last Buy/Sell signal with entry price)
This reduces the need for multiple indicators and gives traders a command-center view directly on the chart.
________________________________________
J. Alerts
The tool generates alerts whenever a Buy or Sell condition is met. Traders can set up TradingView alerts to be notified instantly when:
• Buy Signal Alert → RSI oversold + Bullish inside candle
• Sell Signal Alert → RSI overbought + Bearish inside candle
This ensures no opportunity is missed even if you’re not actively monitoring the chart.
________________________________________
K. Background Highlights
The chart background also changes faintly (light green or light red) when a Buy or Sell condition is triggered. This gives traders visual confirmation along with signals and alerts.
________________________________________
3. Practical Use of This Tool
• Scalpers & Intraday Traders can use it for quick momentum-based entries.
• Swing Traders can use the RSI + Inside Candle + Pivot Points to find medium-term reversals.
• Analysts can use the dashboard for real-time summaries in reports.
• Volume Analysis helps understand institutional activity.
Remember: This is not a standalone holy grail. It must be used with proper risk management and confirmation from higher timeframes.
________________________________________
4. Strict Disclaimer (aiTrendview)
⚠️ Disclaimer from aiTrendview:
This indicator is designed for educational and analytical purposes only. It is not financial advice or a guaranteed trading strategy. Markets are inherently risky and unpredictable; past performance of indicators does not ensure future results. Trading involves risk of financial loss, and traders must use proper risk management, stop-loss, and independent judgment.
aiTrendview strictly follows TradingView.com rules and compliance guidelines.
Any misuse of this tool, its code, or analytical features for unauthorized commercial purposes, false promises, or misleading activities is strictly discouraged. The creators of this script and aiTrendview will not be responsible for any losses, damages, or misuse arising from its application. Always trade responsibly and only with money you can afford to lose.
________________________________________