

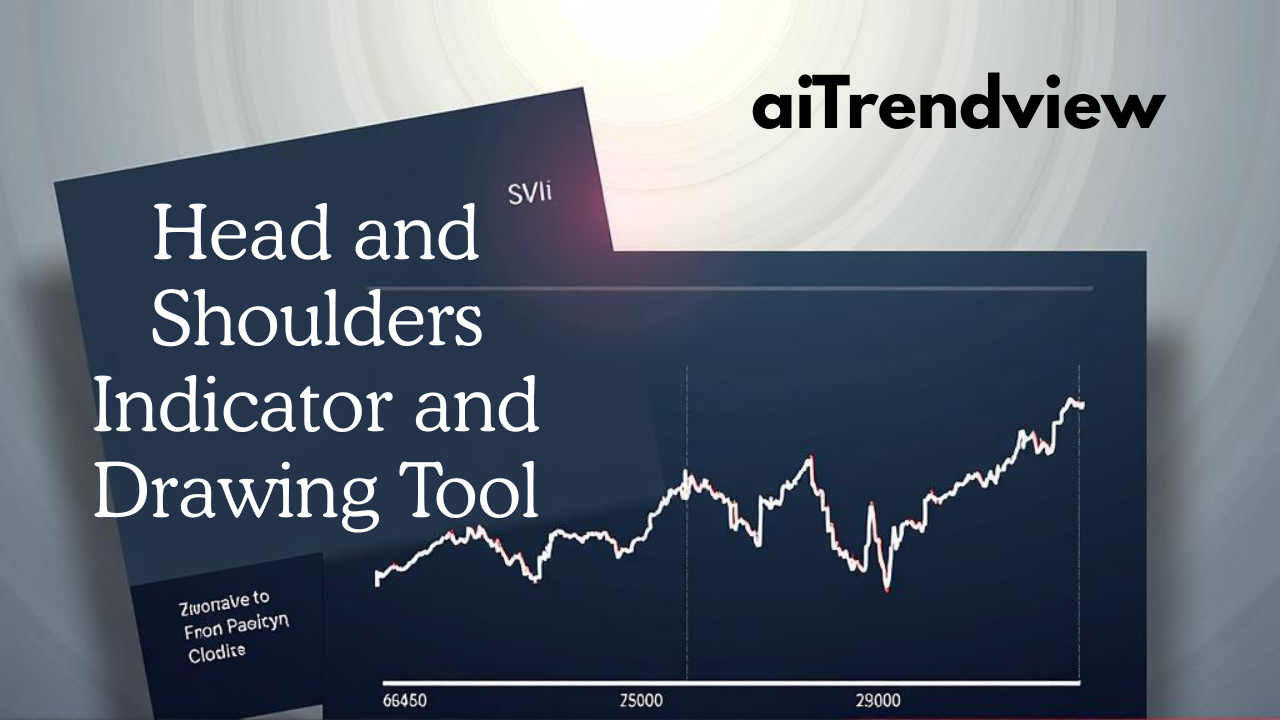
Master Chart Patterns: The Head and Shoulders Indicator and Drawing Tool
In the world of technical analysis, chart patterns are a powerful way to predict potential future price movements. Among these, the Head and Shoulders pattern is one of the most well-known and reliable reversal patterns. It signals a potential shift from a bullish to a bearish trend, or vice versa.
What is the Head and Shoulders Pattern?
The classic Head and Shoulders pattern consists of three peaks:
A neckline, which is a support line connecting the low points of the left and right shoulders, is crucial to the pattern. A confirmed breakdown below this neckline is often a strong signal for a significant bearish move.
Key Takeaways from the TradingView Tutorial
The 13-minute and 47-second tutorial likely provides a detailed walkthrough of how to use TradingView’s dedicated tools to identify and trade this pattern. Here’s what you can expect to learn:
By watching this tutorial, traders can add a powerful new tool to their technical analysis arsenal. The Head and Shoulders pattern, when properly identified and traded, can lead to high-probability setups and is a must-know for anyone serious about chart analysis.
Disclaimer from aiTrendview.com
The content provided in this blog post is for educational and training purposes only. It is not intended to be, and should not be construed as, financial, investment, or trading advice. All charting and technical analysis examples are for illustrative purposes. Trading and investing in financial markets involve substantial risk of loss and are not suitable for every individual. Before making any financial decisions, you should consult with a qualified financial professional to assess your personal financial situation.


© Copyright 2025. All Rights Reserved By aiTrendview.com a AQJ TRADERS Product
1) or fractional share
Investing in the stock markets carries risk: the value of investments can go up as well as down and you may receive back less than your original investment. Individual investors should make their own decisions or seek independent advice.