

Unlock Financial Data on TradingView: A Guide to the Symbol Page Financials Tab
TradingView is a platform that goes far beyond just charts and indicators. For investors and fundamental analysts, the rich financial data it provides is just as valuable. The Symbol Page Financials Tab is a hidden gem that gives you a quick and comprehensive look into a company’s financial health.
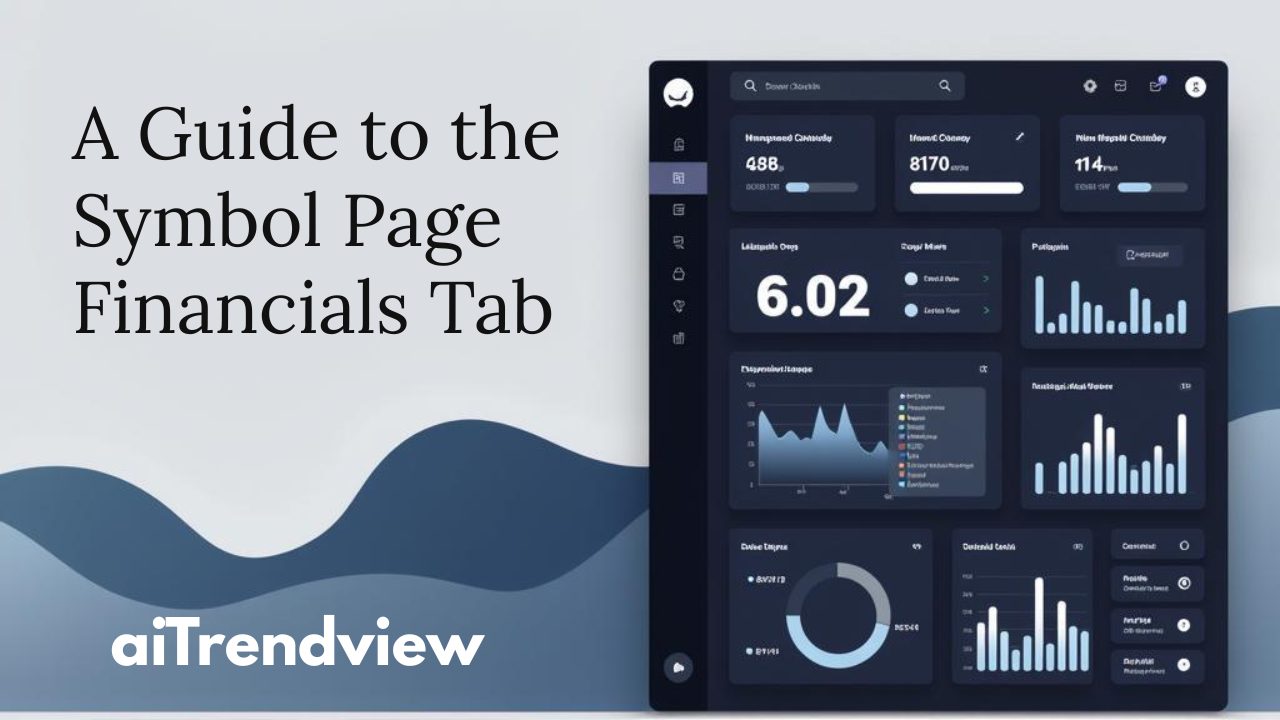
What is the Symbol Page Financials Tab?
When you search for any stock symbol on TradingView, you’ll land on a dedicated Symbol Page. This page provides a wealth of information, from a company overview and news to technical analysis. The Financials Tab is where all the core financial statements and key metrics are neatly organized.
The tab is typically broken down into a few main sections:
Why This Tutorial is a Must-Watch for Fundamental Analysts
The 11-minute and 28-second tutorial likely provides a detailed walkthrough of how to navigate and interpret this data. Here’s what you can expect to learn:
By watching the tutorial, you can learn to leverage TradingView’s comprehensive financial data to make more informed investment decisions. This tab provides a streamlined way to combine your technical and fundamental analysis, giving you a more holistic view of any asset you’re interested in.
Disclaimer from aiTrendview.com
The content provided in this blog post is for educational and training purposes only. It is not intended to be, and should not be construed as, financial, investment, or trading advice. All charting and technical analysis examples are for illustrative purposes. Trading and investing in financial markets involve substantial risk of loss and are not suitable for every individual. Before making any financial decisions, you should consult with a qualified financial professional to assess your personal financial situation.


© Copyright 2025. All Rights Reserved By aiTrendview.com a AQJ TRADERS Product
1) or fractional share
Investing in the stock markets carries risk: the value of investments can go up as well as down and you may receive back less than your original investment. Individual investors should make their own decisions or seek independent advice.