


The aiTrendview.com Elliott Wave Probability System Pro
To access Tradingview Indicator for FREE Click Here
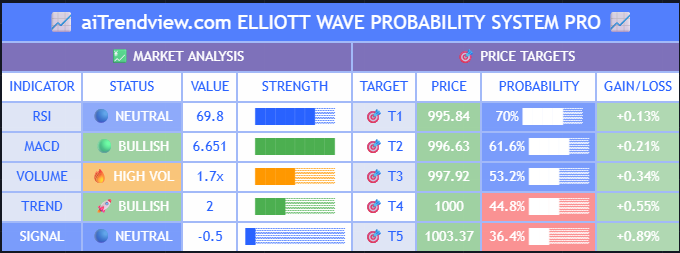
The aiTrendview.com Elliott Wave Probability System Pro is an advanced Pine Script tool created for professional traders who rely on a combination of Elliott Wave Theory, Fibonacci levels, trend strength detection, and momentum indicators like RSI, MACD, and Volume. It provides a comprehensive view of market behaviour and helps identify high-probability entry and exit points. Its key highlight is the intelligent horizontal summary table which converts complex analysis into a readable dashboard with clear signals and probability-based price targets.
At the core of the script is the Elliott Wave detection engine, which identifies swing highs and lows using user-defined pivot sensitivity. The setting for “Wave Detection Period” controls the depth of the pivot lookback. A higher value identifies larger wave structures ideal for swing trading, while lower values suit scalping or short-term patterns. These waves form the foundation for calculating Fibonacci retracement and extension levels, which help project potential reversal zones or continuation targets. If “Show Wave Labels” and “Show Wave Lines” are enabled, you’ll see these pivots marked on the chart, making wave pattern recognition simpler.
The script then overlays Fibonacci levels based on a configurable lookback window. This allows traders to view natural retracement and extension levels between the most recent high and low over a chosen candle range. These levels are commonly used by professionals to time entries during pullbacks and exits near extensions. Buying near the 0.382 or 0.5 retracement during a bullish trend, or selling near the 1.0 or 1.618 extension in an overbought market, is a proven strategy when combined with trend and volume confirmation.
For momentum and confirmation, several technical indicators are used. The RSI (Relative Strength Index) helps identify overbought and oversold conditions. When RSI drops below 30, the asset is considered oversold (potential buy), and when above 70, it’s overbought (potential sell). MACD, calculated from exponential moving averages, helps identify momentum shifts. A bullish signal occurs when the MACD line crosses above the signal line with increasing histogram; bearish signals are the opposite. Stochastic oscillator values are used internally to further fine-tune bullish or bearish setups. Volume is evaluated through a moving average comparison, and spikes in volume above the 1.5x average can indicate the beginning of a significant move. Together, these indicators provide robust validation for price movements.
One of the most powerful features of this system is trend detection, which uses a multi-layer scoring method.
The trend engine looks at price position within the recent high-low range, slope from linear regression, crossover of moving averages (20 vs. 50), formation of higher highs and higher lows, and the ratio of up-bars to down-bars over the lookback period. These factors combine into a numerical trend score. If the score exceeds a threshold, the trend is classified as bullish or bearish. This helps traders stay on the right side of the market. A strong bullish trend with other indicator confirmation signals a high-probability long trade, while a strong bearish score signals potential short opportunities.
The heart of the system is the probability scoring model. It quantifies various market conditions (RSI, MACD, Volume, Wave Position, Trend Strength) and compiles them into a single score ranging from -10 to +10. This score is then normalized to a 0–100% probability scale and classified into actionable signals such as “🟢 STRONG BUY” or “🔴 STRONG SELL.” These labels appear in the dashboard table with corresponding progress bars, making the system intuitive and quick to interpret. A strong buy signal (score > 3) with high volume and bullish trend is an ideal setup to go long. Conversely, a strong sell signal (score < -3) with declining volume and bearish MACD histogram is a sign to either short or exit long positions.
The system also calculates adaptive price targets based on Fibonacci extensions from the current price. Depending on whether the trend is bullish or bearish, it projects up to 5 price targets using levels like 0.236, 0.382, 0.618, 1.0, and 1.618. Each target is assigned a probability based on the distance and current trend confidence. For example, in a strong bullish setup, Target 1 might have 70% probability while further targets have decreasing chances. The gains or losses from each target are calculated as a percentage from the current close, allowing traders to decide which targets to aim for and where to partially book profits.
All of this information is presented in a sleek horizontal summary table at the bottom of the screen. The table is divided into two sections.
On the left, it shows market indicators like RSI, MACD, Volume, Trend Score, and the overall Signal, each with status, value, and visual strength bars. On the right, it lists the next five price targets along with their target price, probability percentage, and potential gain/loss. The table is fully configurable in size and position to suit different screen layouts. Progress bars, emojis, and color-coded backgrounds make the table easy to read at a glance—even for novice traders.
To trade with this system, a trader should first look at the “Signal” row in the table. If the signal is 🟢 STRONG BUY and the trend is 🚀 BULLISH, with volume and MACD also aligned, it confirms a potential long entry. Entry can be done on a breakout above the last pivot high or near the 0.382 Fibonacci retracement. Price targets (T1–T5) help in profit planning and setting partial exit zones. If the signal is 🔴 STRONG SELL and the trend is 📉 BEARISH, shorting opportunities arise, especially if volume is declining and RSI is overbought.
Alerts are also built in to notify the user when strong buy/sell signals or trend changes occur in real-time. This system is ideal for swing and position traders who want to combine Elliott Wave theory with probability-based price targets. Scalpers can adjust the settings to lower wave and lookback periods to adapt to intraday moves. The script is designed to reduce analysis time by giving a powerful snapshot of the market in one unified view.
⚠️ DISCLAIMER
The aiTrendview.com Elliott Wave Probability System Pro is a technical analysis-based tool. It does not guarantee profits and should be used with other confirmations like market context, risk management, and position sizing. Always test in paper trading or back-testing before using real capital.


