


Study Material for the “Dynamic Trading Dashboard”
To access Tradingview Indicator for FREE Click Here
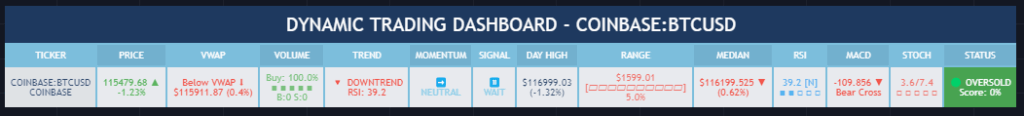
This Dynamic Trading Dashboard is designed as an educational tool within the TradingView environment. It compiles commonly used market indicators and analytical methods into one visual interface so that traders and learners can see relationships between indicators and price action. Understanding these indicators, step by step, can help traders develop discipline, improve technical analysis skills, and build strategies. Below is a detailed explanation of each module.
________________________________________
1. Price and Daily Reference Points
The dashboard displays the current price, along with percentage change compared to the day’s opening price. It also highlights whether the price is moving upward or downward using directional symbols. Alongside, it tracks daily high, low, open, and daily range.
For traders, daily levels provide valuable reference points. The daily high and low are considered intraday support and resistance, while the median price of the day often acts as a pivot level for mean reversion traders. Monitoring these helps learners see how price oscillates within daily ranges.
________________________________________
2. VWAP (Volume Weighted Average Price)
VWAP is calculated as a cumulative average price weighted by volume. The dashboard compares the current price with VWAP, showing whether the market is trading above or below it.
For traders, VWAP is often a guide for institutional order flow. Price trading above VWAP suggests bullish sentiment, while trading below VWAP indicates bearish sentiment. Learners can use VWAP as a training tool to recognize trend-following vs. mean reversion setups.
________________________________________
3. Volume Analysis
The system distinguishes between buy volume (when the closing price is higher than the open) and sell volume (when the closing price is lower than the open). A progress bar highlights the ratio of buying vs. selling activity in percentage.
This is useful because volume confirms price action. For instance, if prices rise but sell volume dominates, it can signal weakness. New traders learning with this tool should focus on how volume often precedes price reversals and trends.
________________________________________
4. RSI (Relative Strength Index)
RSI is a momentum oscillator that measures price strength on a scale from 0 to 100. The dashboard classifies RSI readings into overbought (>70), oversold (<30), or neutral zones and adds visual progress bars.
RSI helps learners understand momentum shifts. During training, one should notice how trending markets can keep RSI extended for longer periods (not immediate reversal signals), while range-bound markets react more sharply to RSI extremes. It is an excellent tool for practicing trend vs. range identification.
________________________________________
5. MACD (Moving Average Convergence Divergence)
The MACD indicator involves a fast EMA, slow EMA, and signal line, with focus on crossovers. The dashboard shows whether a “bullish cross” (MACD above signal line) or “bearish cross” (MACD below signal line) has occurred.
MACD teaches traders to identify trend momentum shifts and divergence. During practice, traders can explore how MACD signals align with VWAP trends or RSI levels, which helps in building a structured multi-indicator analysis.
________________________________________
6. Stochastic Oscillator
This indicator compares the current close relative to a range of highs and lows over a period. Displayed values oscillate between 0 and 100, marking zones of overbought (>80) and oversold (<20).
Stochastics are useful for students of trading to recognize short-term momentum changes. Unlike RSI, it reacts faster to price volatility, so false signals are common. Part of the training exercise can be to observe how stochastic “flips” can align with volume surges or daily range endpoints.
________________________________________
7. Trend & Momentum Classification
The dashboard adds simple labels for trend (uptrend, downtrend, neutral) based on RSI thresholds. Additionally, it provides quick momentum classification (“bullish hold”, “bearish hold”, or neutral).
This is beneficial for beginners as it introduces structured thinking: differentiating long-term market bias (trend) from short-term directional momentum. By combining both, traders can practice filtering signals instead of trading randomly.
________________________________________
8. Accumulation / Distribution Bias
Based on RSI levels, the script generates simplified tags such as “Accumulate Long”, “Accumulate Short”, or “Wait”.
This is purely an interpretive guide, helping learners think in terms of accumulation phases (when markets are low) and distribution phases (when markets are high). It reinforces the concept that trading is not only directional but also involves timing.
________________________________________
9. Overall Market Status and Score
Finally, the dashboard compiles multiple indicators (VWAP position, RSI, MACD, Stochastics, and price vs. median levels) into a Market Score expressed as a percentage. It also labels the market as Overbought, Oversold, or Normal.
This scoring system isn’t a recommendation but a learning framework. Students can analyze how combining different indicators improves decision-making. The key training focus here is confluence: not depending on one indicator but observing when several conditions align.
Extended Study Material with Formulas
________________________________________
1. Daily Reference Levels (High, Low, Open, Median, Range)
• Day High (H): Maximum price of the session.
DayHigh=max(Hightoday)DayHigh=max(Hightoday)
• Day Low (L): Minimum price of the session.
DayLow=min(Lowtoday)DayLow=min(Lowtoday)
• Day Open (O): Opening price of the session.
DayOpen=OpentodayDayOpen=Opentoday
• Day Range:
Range=DayHigh−DayLowRange=DayHigh−DayLow
• Median: Mid-point between high and low.
Median=DayHigh+DayLow2Median=2DayHigh+DayLow
These act as intraday guideposts for seeing how far the price has stretched from its key reference levels.
________________________________________
2. VWAP (Volume Weighted Average Price)
VWAP considers both price and volume for a weighted average:
VWAPt=∑i=1t(Pricei×Volumei)∑i=1tVolumeiVWAPt=∑i=1tVolumei∑i=1t(Pricei×Volumei)
Here, Price_i can be the average price (High + Low + Close) ÷ 3, also known as hlc3.
• Interpretation: Price above VWAP = bullish bias; Price below = bearish bias.
________________________________________
3. Volume Buy/Sell Analysis
The dashboard splits total volume into buy volume and sell volume based on candle type.
• Buy Volume:
BuyVol=Volumeif Close > Open, else 0BuyVol=Volumeif Close > Open, else 0
• Sell Volume:
SellVol=Volumeif Close < Open, else 0SellVol=Volumeif Close < Open, else 0
• Buy Ratio (%):
VolumeRatio=BuyVolBuyVol+SellVol×100VolumeRatio=BuyVol+SellVolBuyVol×100
This helps traders gauge who is in control during a session—buyers or sellers.
________________________________________
4. RSI (Relative Strength Index)
RSI measures strength of momentum by comparing gains vs. losses.
Step 1: Compute average gains (AG) and losses (AL).
AG=Average of Upward Closes over N periodsAG=Average of Upward Closes over N periodsAL=Average of Downward Closes over N periodsAL=Average of Downward Closes over N periods
Step 2: Calculate relative strength (RS).
RS=AGALRS=ALAG
Step 3: RSI formula.
RSI=100−1001+RSRSI=100−1+RS100
• Used to detect overbought (>70), oversold (<30), or neutral momentum zones.
________________________________________
5. MACD (Moving Average Convergence Divergence)
• Fast EMA:
EMAfast=EMA(Close,length=fast)EMAfast=EMA(Close,length=fast)
• Slow EMA:
EMAslow=EMA(Close,length=slow)EMAslow=EMA(Close,length=slow)
• MACD Line:
MACD=EMAfast−EMAslowMACD=EMAfast−EMAslow
• Signal Line:
Signal=EMA(MACD,length=signal)Signal=EMA(MACD,length=signal)
• Histogram:
Histogram=MACD−SignalHistogram=MACD−Signal
Crossovers between MACD and Signal are used in studying bullish/bearish phases.
________________________________________
6. Stochastic Oscillator
Stochastic compares the current close against a range of highs and lows.
%K=Close−LowestLowHighestHigh−LowestLow×100%K=HighestHigh−LowestLowClose−LowestLow×100
Where LowestLow and HighestHigh are the lowest and highest values over N periods.
The %D line is a smooth version of %K (using a moving average).
%D=SMA(%K,smooth)%D=SMA(%K,smooth)
• Values above 80 = overbought; below 20 = oversold.
________________________________________
7. Trend and Momentum Classification
This dashboard generates simplified trend/momentum logic using RSI.
• Trend:
• RSI < 40 → Downtrend
• RSI > 60 → Uptrend
• In Between → Neutral
• Momentum Bias:
• RSI > 70 → Bullish Hold
• RSI < 30 → Bearish Hold
• Otherwise Neutral
This is not predictive, only a classification framework for educational use.
________________________________________
8. Accumulation/Distribution Bias
Based on extreme RSI values:
• RSI < 25 → Accumulate Long Bias
• RSI > 80 → Accumulate Short Bias
• Else → Wait/No Action
This helps learners understand the idea of accumulation at lows (strength building) and distribution at highs (profit booking).
________________________________________
9. Overall Market Status and Score
The tool adds up 5 bullish conditions:
1. Price above VWAP
2. RSI > 50
3. MACD > Signal
4. Stochastic > 50
5. Price above Daily Median
BullishScore=ConditionsMet5×100BullishScore=5ConditionsMet×100
Then it categorizes the market:
• RSI > 70 or Stoch > 80 → Overbought
• RSI < 30 or Stoch < 20 → Oversold
• Else → Normal
This encourages learners to think in terms of probabilistic conditions instead of single-indicator signals.
________________________________________
⚠️ Warning:
• Trading financial markets involves substantial risk.
• You can lose more money than you invest.
• Past performance of indicators does not guarantee future results.
• This script must not be copied, resold, or republished without authorization from aiTrendview.
By using this material or the code, you agree to take full responsibility for your trading decisions and acknowledge that this is not financial advice.
________________________________________
⚠️ Disclaimer and Warning (From aiTrendview)
This Dynamic Trading Dashboard is created strictly for educational and research purposes on the TradingView platform. It does not provide financial advice, buy/sell recommendations, or guaranteed returns. Any use of this tool in live trading is completely at the user’s own risk. Markets are inherently risky; losses can exceed initial investment.
The intellectual property of this script and its methodology belongs to aiTrendview. Unauthorized reproduction, modification, or redistribution of this code is strictly prohibited. By using this study material or the script, you acknowledge personal responsibility for any trading outcomes. Always consult professional financial advisors before making investment decisions.


