


CrossVantage Dashboard: Study Material for Traders
To access Tradingview Indicator for FREE Click Here
The CrossVantage Dashboard is a technical trading indicator designed to provide a comprehensive market analysis dashboard overlay on price charts. It integrates smoothed weighted moving averages (WMAs), RSI, VWAP, volume, pivot points, and real-time trade signal generation into a compact visual interface. This material explains the core calculations, signal logic, support and resistance visualization, and how to interpret the dashboard table for effective trading decisions.
________________________________________
How the CrossVantage Dashboard Works
Core Components and Calculations
1. Smoothed Weighted Moving Averages (WMA)
o Two WMAs are calculated on the closing price:
Short WMA with length 60 (after smoothing).
Long WMA with length 120 (after smoothing).
o These act as trend-following components where crossovers suggest potential entries or exits.
2. Relative Strength Index (RSI)
o RSI is calculated with a standard 14-period length.
o A threshold of 50 is used to confirm momentum direction:
Above 50 suggests bullish momentum.
Below 50 suggests bearish momentum.
3. Volume Analysis
o Separates buy volume (volume on bullish candles) and sell volume (volume on bearish candles).
o Helps assess market participation on either side.
4. Volume Weighted Average Price (VWAP)
o VWAP is calculated based on the typical price (HLC3).
o Acts as a dynamic reference for price mean levels during the trading session or timeframe.
Trade Signal Generation
• When the short WMA crosses above the long WMA and RSI is above 50, a bullish crossover condition is detected.
• When the short WMA crosses below the long WMA and RSI is below 50, a bearish crossover condition is detected.
• These crossover conditions initiate a waiting state for confirmation:
o The bullish confirmation requires price to close above the crossover close.
o The bearish confirmation requires price to close below the crossover close.
• Upon confirmation, a trade signal is generated:
o “ENTRY LONG” for bullish confirmation.
o “ENTRY SHORT” for bearish confirmation.
• The signal remains active with recorded entry price, high, and low.
Pivot Point Calculations for Support and Resistance
• Pivot points, support (S1, S2, S3), and resistance (R1, R2, R3) levels are calculated based on the previous period’s high, low, and close.
• Period options include Daily, Weekly, or Monthly.
• These levels are displayed as dotted lines on the chart when a trade signal is active, providing dynamic support/resistance visualization relevant for current positions.
________________________________________
Dashboard Table Features and Interpretation
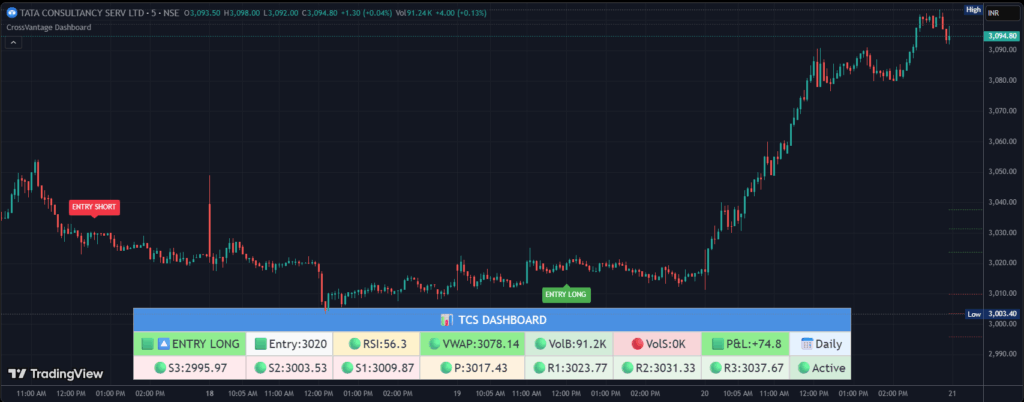
The dashboard table overlays the chart and summarizes the key metric values and trade signals in an intuitive layout with visual cues (color cubes, arrows, progress indicators).
Field Description and Interpretation
Signal Status Shows current trade signal: ENTRY LONG (🔼) or ENTRY SHORT (🔽) or NONE (⏸️), with a colored cube indicating activation.
Entry Price Displays entry price of active trade signal along with a progress cube showing if current price is favorable vs. entry.
RSI Shows current RSI value with a trend cube indicating RSI momentum direction (up, down, or stable) and color-coded zones (overbought/oversold).
VWAP Displays VWAP value; cube indicates whether price is above (green cube) or below (red cube) VWAP, helping gauge intraday trend bias.
Buy Volume (VolB) Shows buy volume on bullish candles with cube indicating volume trend versus previous bar.
Sell Volume (VolS) Shows sell volume on bearish candles with cube indicating volume trend versus previous bar.
P&L Displays current profit or loss since entry price with cube indicating favorable movement (green) or unfavorable (red).
Pivot Period Shows pivot point period selected (Daily/Weekly/Monthly) for support/resistance calculations.
Support/Resistance Levels (S3, S2, S1, P, R1, R2, R3) When trade signal is active, these levels are displayed with cubes indicating whether current price is above or below each level. Useful for planning entries, stops, and targets.
Visual Cues
• Cubes (🟩🟥🟡) represent positive, negative, or neutral conditions respectively.
• Arrows (🔼🔽) indicate direction of trade signals.
• Colored backgrounds provide immediate visual status distinctions, such as green for bullish, red for bearish, and yellow/orange for caution or neutral states.
________________________________________
Interpreting the Dashboard for Trading
• When the dashboard shows ENTRY LONG with green cubes and upward arrows, favor long positions.
• Confirm signals through RSI above 50 and price above VWAP for added conviction.
• Use support levels (S1, S2, S3) as potential entry or stop zones.
• When the dashboard shows ENTRY SHORT with red cubes and downward arrows, favor short positions.
• Confirm signals through RSI below 50 and price below VWAP.
• Use resistance levels (R1, R2, R3) as potential targets or stops.
• Monitor volume trends to understand buying/selling pressure supporting the signals.
• Use the Profit & Loss field to monitor current trade performance and manage risk accordingly.
• When no signal is active, the dashboard advises waiting for setups to confirm crossover conditions.
________________________________________
Chart Visualizations
• Trade entry signals are plotted on the chart as small labels: “ENTRY LONG” below bars and “ENTRY SHORT” above bars.
• Support and resistance lines for active trades are drawn as dotted horizontal lines in red (supports) and green (resistances).
• These visual guides aid in managing active trades and making informed entry/exit decisions.
________________________________________
Alerts
The indicator supports alerts on confirmed entry signals for automation of trade monitoring and instant notifications.
________________________________________
Disclaimer
The CrossVantage Dashboard indicator is designed for educational and informational purposes only. It does not guarantee trading success or profits and should not substitute personal analysis or professional financial advice. Always apply appropriate risk management and verify signals with your trading strategy before acting.
________________________________________
This detailed explanation aims to help traders understand the CrossVantage Dashboard indicator’s components, signals, and dashboard visualization to enhance trading decisions effectively.


