
Global Crude Oil Market Outlook – November 2025
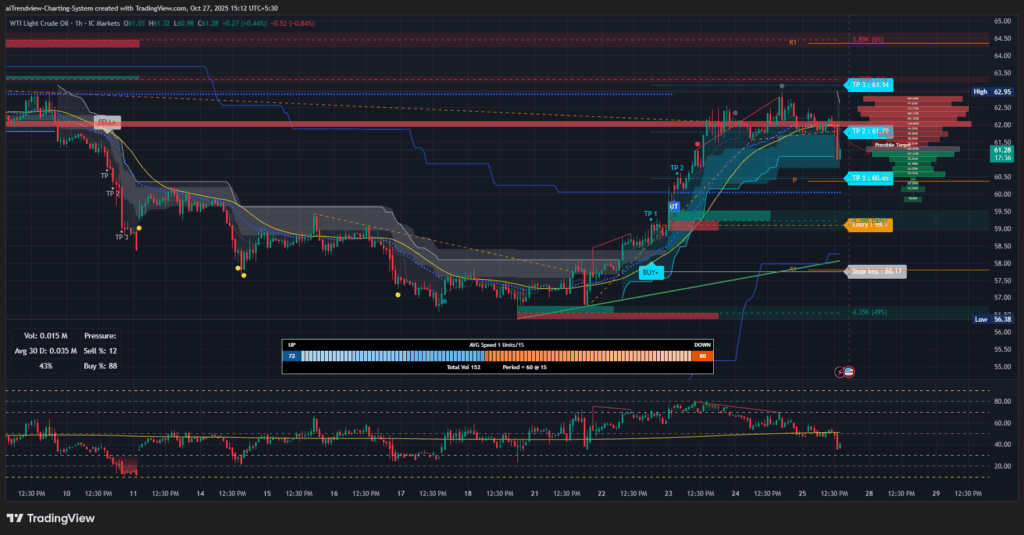
Technical Analysis (WTI & Brent)
- WTI (West Texas Intermediate): Oil prices have trended downward since mid-2025, falling from the mid-$70s to the high-$50s per barrel. By late October, WTI appeared oversold on the RSI and has since rebounded; the RSI has climbed from the low 30s into the 40s. The MACD momentum indicator, after a long period in negative territory, is flattening out and is poised for a bullish crossover on the shorter time frame. All major moving averages (20-day, 50-day, 100-day) lie above current prices and are sloping downward, confirming that the overall trend is bearish. On the price chart, an inverse head-and-shoulders base has formed around early-October lows (~$58), and WTI has since broken its neckline near $60. This pattern break suggests a near-term recovery attempt. Key resistance is now seen in the $62–$64 area (the recent highs and the 50-day MA); a sustained move above this zone would open a path to test the mid-$60s. If WTI fails to clear $62, renewed selling could drive it back toward $58 or lower. In summary, technical signals point to a tentative corrective rally under way, but with the dominant downtrend intact until higher resistance levels are decisively cleared.
- Brent (North Sea): Brent crude has shown a very similar pattern. After sliding from the mid-$70s, Brent found support around $60, forming a double-bottom with bullish candlestick signals (hammer and engulfing patterns) in mid-late October. Its RSI also moved from oversold territory toward neutral (rising into the 30s and 40s), and the MACD, while still below zero, is flattening, suggesting a loss of downward momentum. Brent’s 20- and 50-day moving averages remain above current prices and trending downward. Recently Brent tested the $62–$63 area (near the 50-day MA and downtrend line) and has hesitated there. A daily close above ~$62.3–$63 would validate the short-term bounce and could target ~$64–$65 or higher. However, failure to hold above $62 would leave Brent vulnerable to retesting support near $60 and possibly sliding toward the upper-$50s. Overall, Brent’s short-term chart is showing early signs of a rebound from an oversold extreme, but until it breaks above the key resistance trendline, the intermediate-term trend remains down.
Fundamental Analysis
- Supply and Demand Balance: Global oil supply growth is outpacing demand growth. In 3Q25, world supply surged (led by OPEC+ and the U.S.) while demand growth has been muted. Forecasts for 2025 suggest total demand growth of roughly 0.7–1.0 million barrels per day (mb/d), concentrated in areas like Asia, whereas OECD demand is flat to declining due to efficiency gains and economic headwinds. On the supply side, OPEC+ has resumed raising output (about +0.1–0.2 mb/d per month as they unwind cuts) and U.S. production is at record highs (~13.5 mb/d) after rapid shale growth. Non-OPEC producers (Brazil, Canada, etc.) are also adding barrels. Seasonal demand has peaked for the summer driving season in the Northern Hemisphere and only modestly picks up for winter heating, so demand is relatively steady. Inventories are building: OECD commercial stocks are at high levels and global “oil on water” shipments have grown, reflecting a looming surplus. In short, the market is facing a supply glut, with production increases exceeding the slow pace of demand growth.
- OPEC+ Policy: OPEC+ has signaled continued easing of voluntary cuts. In October 2025 the group agreed to add another 137,000 bpd to production in November, continuing a policy of gradual output increases. This represents the unwinding of cuts that were put in place over prior years. While Saudi Arabia has spare capacity and eyed larger increases (to regain market share), Russia preferred only modest hikes due to its own production limits under sanctions. OPEC+ statements suggest they view fundamentals as “steady” but are moving cautiously. With their output targets already up by some 2.7 mb/d in 2025, the group expects some surplus pressures. The near-term implication is that OPEC+ will likely keep supplies ample rather than sharply tighten, consistent with a baseline scenario of stable-to-lower prices. OPEC+ will review policy again at an early-November meeting, but most signals are that no major cuts are planned unless prices fall dramatically.
- Geopolitical and Strategic Reserves: Geopolitical risks offer limited support amid the oversupply. Sanctions on Iran and Venezuela keep some barrels off the market, but Iran has continued to sell some oil via alternative channels to buyers like China and India. In Russia, attacks on pipelines and continued Western sanctions have constrained crude exports somewhat, but barrels still find their way to markets. Other hot spots (Red Sea/Houthi disruptions, Nigeria’s outages, Middle East tensions) remain watch factors, but so far haven’t tightened global supply enough to reverse the surplus trend. Importantly, the U.S. government is now replenishing its Strategic Petroleum Reserve (SPR) by buying about 1 million barrels to be stored in late 2025, lifting bids around current price levels; this adds a small demand-support cushion. Overall, while geopolitical flare-ups could cause volatile spikes, the dominant force is the easing supply situation.
- China and India Trends: Asian demand dynamics are mixed. China’s oil consumption growth has slowed significantly as its economy matures. Transportation fuel use (gasoline, diesel, jet) has plateaued and may even contract due to aggressive EV adoption and a shift to services-led growth. China has instead been accumulating crude in stockpiles, suggesting internal demand weakness. The IEA notes China’s fuel demand is near a peak. By contrast, India remains a major demand driver: strong GDP growth and rising vehicle ownership have kept India’s oil consumption climbing by around 4–5% annually. India is expected to add the largest share of global oil demand in 2025. In sum, Chinese demand provides little upside (at best flat), while India (and other emerging economies) continue to support modest global demand growth. These Asian trends help explain why, despite strong Indian needs, overall demand growth is subdued.
- U.S. Market and Inventories: In the United States (the world’s largest consumer), crude oil production hit record levels in summer 2025 and is forecast to stay near the mid-13 mb/d range. Domestic refinery runs are seasonally moderate. U.S. petroleum inventories rose recently, despite some draws on motor gasoline stocks; the net effect is further builds, especially in crude and product stocks. Gasoline demand remains relatively weak (reflecting fuel efficiency and EVs), though diesel demand has firmed with industrial activity. The Trump administration’s SPR purchases slightly boost U.S. oil demand, but U.S. product exports (especially of gasoline) also keep flows moving outward. Overall, the U.S. market is well supplied with domestic crude and ample product inventories, contributing to downward pressure on prices.
Top Oil Producers and Consumers
| Rank | Top 10 Producers (2023) | Production (mb/d) | Reserves (billion bbl) |
| 1 | United States | 21.9 | 45 |
| 2 | Saudi Arabia | 11.1 | 267 |
| 3 | Russia | 10.8 | 80 |
| 4 | Canada | 5.8 | 4.3 |
| 5 | China | 5.3 | 28.2 |
| 6 | Iraq | 4.4 | 145 |
| 7 | Brazil | 4.3 | 15.9 |
| 8 | United Arab Emirates | 4.2 | 113 |
| 9 | Iran | 4.0 | 208.6 |
| 10 | Kuwait | 2.9 | 101.5 |
| Rank | Top 10 Consumers (2022) | Consumption (mb/d) |
| 1 | United States | 20.0 |
| 2 | China | 15.2 |
| 3 | India | 5.0 |
| 4 | Russia | 3.7 |
| 5 | Saudi Arabia | 3.7 |
| 6 | Japan | 3.4 |
| 7 | Brazil | 3.0 |
| 8 | South Korea | 2.6 |
| 9 | Canada | 2.4 |
| 10 | Germany | 2.2 |
(Production and consumption figures are rounded estimates based on the latest available data.)
November 2025 Price Forecast
- Base Case: In the baseline scenario of continuing moderate demand growth and ample supply, prices are expected to drift modestly lower or range-bound. We assume global inventories will keep building and OPEC+ will maintain cautious increases. In this case WTI crude might trade in roughly the $60–$65 per barrel range, while Brent could be around $65–$70, barring surprises. Seasonal factors (lower U.S. driving demand) and the end of summer maintenance may keep upward pressure limited. Prices would likely oscillate in these bands without major drivers, reflecting the underlying surplus environment.
- Bullish Scenario: Oil prices would trend higher (e.g. WTI $70–$75 or above; Brent $75–$80+) if significant bullish catalysts emerge. Such triggers could include unexpected supply disruptions (e.g. renewed conflicts in the Middle East or Red Sea trade routes, deeper cuts by OPEC+ than anticipated, or an agreement curtailing Russian exports), or a sudden surge in demand (for example, a stronger-than-expected economic rebound in Asia). In this scenario, technical breakouts above key levels (~$64 for WTI, ~$66–$68 for Brent) could gather momentum. Even partial inventory draws (from weather events or Sino-Indian restocking) would help push the market up. A tight market signal, such as a steep backwardation (front-month premiums), could also propel speculative buying. A sustained move back toward mid-$60s for WTI and high-$60s for Brent would be the initial targets in this bullish case.
- Bearish Scenario: Prices would weaken (WTI possibly to $50–$55; Brent to $55–$60 or below) if the market sees a deeper surplus than expected. This could happen if economic activity slows (reducing fuel demand), or if producers flood the market (e.g. OPEC+ abandons quotas entirely or U.S. production jumps even more). A risk is that inventory builds accelerate into year-end, or if China liquidates more stockpiles. In such a case, technical breakdowns below current support ($58 WTI, $60 Brent) would open the next support levels around the upper-$50s or mid-$50s. Negative market sentiment could be amplified by financial flows leaving commodities (e.g. a stronger dollar or falling equity markets). In the harsh downside case, WTI might revisit the low-$50s and Brent the mid-$50s, reflecting the resurgence of an all-out surplus narrative.
Disclaimer
This report is provided for informational and educational purposes only. It is not investment advice, and readers should exercise independent judgment before making any trading or investment decisions. Oil market conditions can change rapidly due to unforeseen events; the analysis above reflects current information and should not be construed as a recommendation.


