

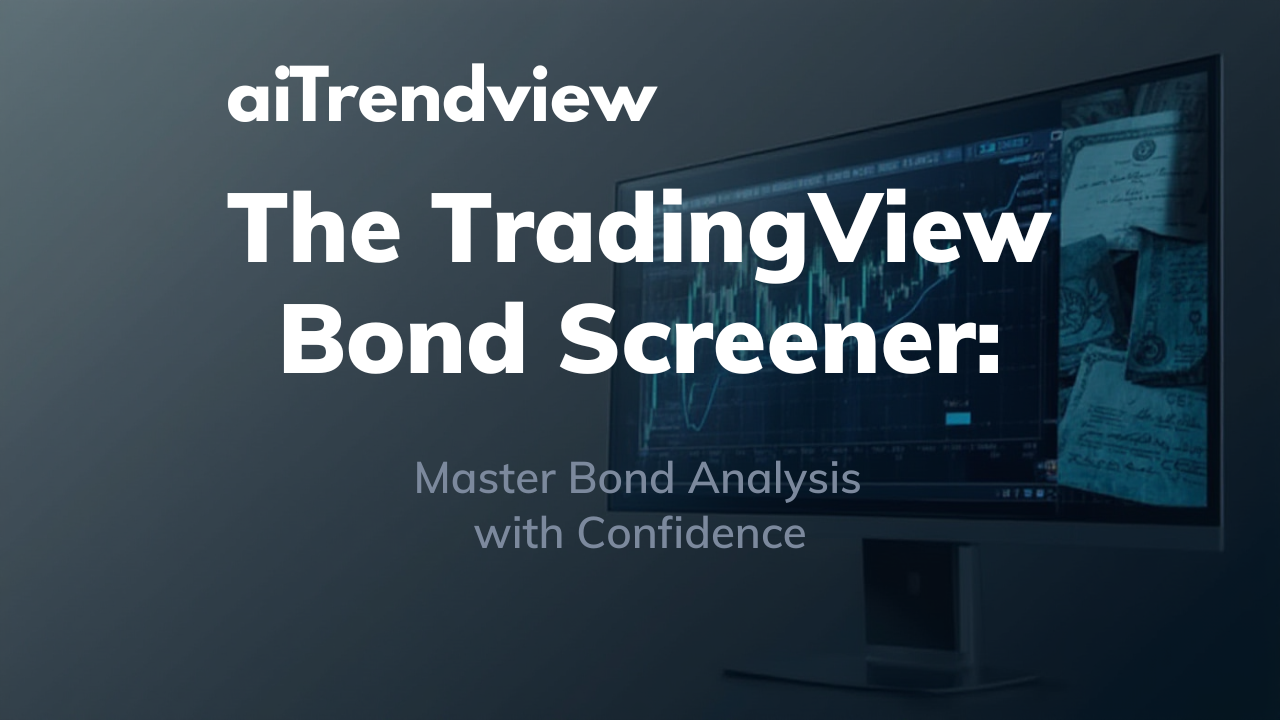
The TradingView Bond Screener
The video introduces the brand-new Bond Screener on TradingView, a powerful tool designed to help users discover, analyse, and track bonds with precision and ease. The screener enables filtering of over 197,000 bonds globally by various criteria such as bond type (corporate, sovereign, agency), issuer country, ratings (e.g., AAA for highest credit quality), coupon rate, maturity, seniority, and many more features relevant to bond investors. This allows users to narrow down bond options to those matching their investment strategies or risk profiles.
Technically, the screener offers advanced filter management, allowing users to activate, customize, and save multiple filters simultaneously. Results are displayed in a customizable table format, providing a clear overview with sortable columns for attributes like coupon percentage, yield to maturity, issue amount, maturity dates, and credit ratings. Users can access detailed bond profiles with key terms, news, and charting capabilities integrated directly into TradingView. Bonds can be charted similarly to stocks, enabling technical analysis on price movements, volume, and yield trends over various timeframes, enhancing bond market insights.
Fundamentally, the tool accentuates the essential bond market concepts: bonds represent debt issued by entities (governments, corporations) that pay interest (coupons) and return principal at maturity. Investors use bond ratings, coupon frequency, yield-to-maturity, and maturity terms to assess risk and return potential. For example, AAA bonds indicate highest creditworthiness, while higher coupons or yields might suggest elevated risk. The screener helps users identify bonds fitting specific risk tolerances and income requirements, supporting strategic investment decisions.
The video demonstrates real use cases like filtering US corporate bonds with minimum coupon and yield thresholds, finding large issue bonds for liquidity assessment, and analyzing specific issuer bonds such as Apple or Microsoft. It also highlights the importance of currency denomination awareness in bond selection and the ability to study bond price trends via TradingView’s charting interface, which can reveal market sentiment and trading activity.
Overall, the TradingView Bond Screener is presented as an advanced, user-friendly platform tool that combines fundamental bond market principles with technical analysis capabilities, empowering investors and traders to efficiently navigate the vast bond universe for tailored portfolio construction and risk management.
1. Overview
This video is a comprehensive tutorial on the TradingView Bond Screener, a powerful tool for finding and analysing bonds. It is designed for traders and investors familiar with the TradingView platform who want to expand their analysis to a new asset class. The briefing explains what bonds are, how to use the screener’s technical features, and the fundamental reasoning behind the filtering process.
2. Fundamental Concepts
3. Technical Functionality: The Screener
The video details the technical steps to navigate and filter over 197,000 bonds [01:04].
4. Applying Fundamental & Technical Reasoning
This section details how to combine the tool’s features with financial reasoning for training.
5. Advanced Analysis: Charting & Symbol Pages
The screener is fully integrated with TradingView’s other analysis tools.
6. Key Learning & Training Takeaways
Disclaimer
The content of this blog is for educational and training purposes only and does not constitute financial, trading, or investment advice. Past performance of technical indicators or trading systems is no guarantee of future results. Trading and investing always involves risk, including loss of principal. Use your own judgement and/or seek advice from a qualified professional before acting on any ideas discussed herein. The aiTrendview brand and its affiliates accept no liability for any trading losses or other damages resulting from the use of this material.


© Copyright 2025. All Rights Reserved By aiTrendview.com a AQJ TRADERS Product
1) or fractional share
Investing in the stock markets carries risk: the value of investments can go up as well as down and you may receive back less than your original investment. Individual investors should make their own decisions or seek independent advice.