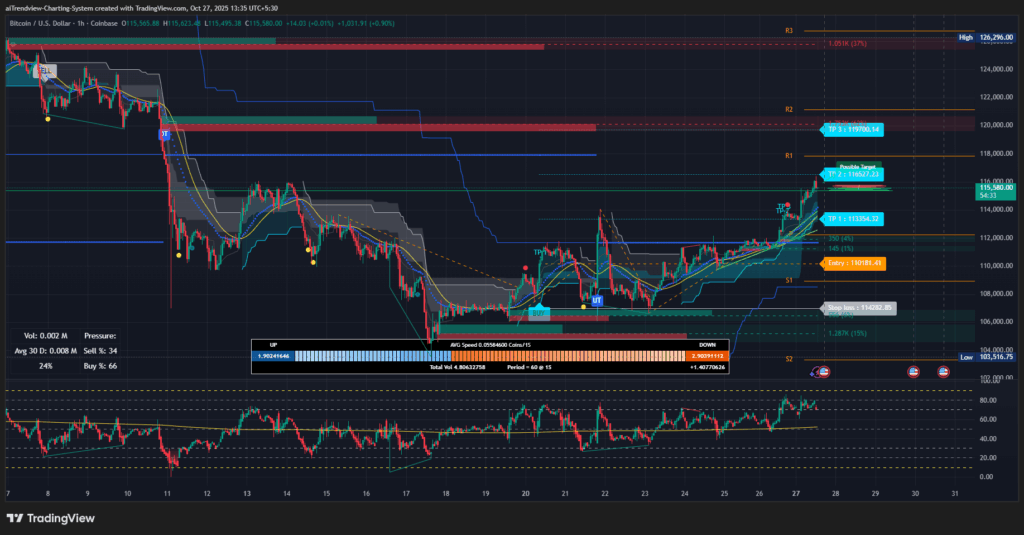
Technical Snapshot: In late October 2025 Bitcoin has carved out a modest rebound. Price is ~115K (as of Oct 27) after a $125K high on Oct 6 and a low near $106K on Oct 17. Notably, BTC has cleared its 50-day SMA and even staged a bullish 5/10-day SMA crossover. The daily MACD has just turned positive (a bullish histogram crossover). Volume has been rising on up-days (≈42.7K BTC on Oct 26, 51.3K on Oct 27 vs ~23.3K midweek, underscoring buyer interest.
Moving Averages: BTC has recently crossed above its 50-day moving average, signaling short-term bullish momentum. It remains above the 10-day and 5-day SMAs (they’ve crossed higher). The 200-day MA (longer-term trend) sits well below current levels (BTC’s multi-year uptrend has kept it well above that average, so the long-term bias is still up).
RSI & Momentum: Daily RSI dipped into oversold territory (around the high-30s) during the mid-October selloff , a level that historically precedes big rebounds. As of now RSI is climbing back (likely in mid-50s range) on this rally, and MACD is bullish. (CoinDesk’s “trend indicator” still flags caution and BTC is just below its Ichimoku cloud resistance.)
Bollinger Bands: Price has been drifting up towards the upper Bollinger band on the daily chart (volatility is moderate), reflecting this short-term squeeze. A decisive close above ~$120K would break the upper band/Ichimoku cloud and open the next leg higher.
Key Support/Resistance: Major resistance lies in the $119–125K zone (recent all-time highs). In particular, the ~$120–124K area (Ichimoku cloud ceiling) and the Oct 6 peak at ~$125.8Kvaneck.com. Near-term support is around $107–110K. That $107–108K zone has held twice (Oct 17 low ~$106.4K, Oct 22 low ~$107.6K. A break below ~$107K would target the psychological $100K level (which also aligns with the 50-week SMA and recent bottoms).
Chart Patterns: Bitcoin’s price action resembles a falling wedge/double-bottom pattern. The steep August–Oct selloff down to ~$106K and subsequent rally form a potential double-bottom around $106–108K. Bulls are eyeing a breakout; failure to reclaim $120K resistance would keep BTC in a broad $100–125K consolidation.
Volume Profile: Trading volume has been higher on up-days (demand), suggesting accumulation. Mining supply is creeping up: miners’ BTC transfers to exchanges jumped 14% in Oct while price only gained 2%, indicating miners are monetizing their production amid tight margins.
Fundamental & Macro Context
Inflation & Rates: Recent US inflation prints were softer than expected (Sept CPI +0.3% vs +0.4% forecast), reinforcing markets’ view that the Fed will deliver rate cuts. Futures now fully price a 25bp Fed cut at the early Nov meeting and ~90% chance of another cut in Dec. This dovish tilt (with 10-year yields sliding below 4.0%) has buoyed risk assets, including BTC.
Global Liquidity: VanEck research highlights that Bitcoin’s long-term price closely tracks global fiat money supply. Changes in top-5 currency M2 explain over 50% of BTC’s decade-long variance. In other words, easing liquidity drives BTC rallies (“anti-money-printing” asset). The mid-Oct downturn coincided with Fed uncertainty and trade frictions, while the bounce reflects renewed expectations of looser policy.
Market Sentiment: Sentiment is cautious. The Crypto Fear & Greed Index has languished in “Fear” territory (reading ~24) for the past week. Historically, extended fear often marks a local bottom. Indeed, Bitcoin has been rangebound between roughly $103K and $115K for two weeks, signifying consolidation. On-chain metrics echo this: VanEck notes active addresses (~723K/day, +2% MoM) and transaction volumes are healthy. BTC’s realized volatility is still elevated, but with RSI oversold (36 mid-Oct), analysts see potential for a rebound. Brave Newcoin reports BTC’s RSI flashing an oversold signal for the first time in months.
On-Chain Metrics: Network fundamentals remain strong. Hash rate and mining difficulty just hit all-time highs (hash rate ~1.12 EH/s in Sept, difficulty ~147T, +10% MoM. Miners are expanding capacity even as profitability falls (~–7% in Sept due to price drop and halving). The miner capitulation (higher exchange flows) partly fuelled the recent dip. Still, long-term on-chain trends (supply held, inscriptions up, etc.) suggest a maturing market. For instance, ~95% of addresses are in profit despite the pullback, indicating strong unrealized gains.
Institutional Flows: Bitcoin ETFs continue modest inflows overall. JPMorgan notes that after mid-Oct, BTC ETF outflows were negligible (only $220M, 0.14% of AUM) while Ether saw larger fund outflows. New ETF approval processes have accelerated (SEC’s new generic listing rules), and flows into spot BTC funds (BlackRock, Fidelity, Grayscale) remain generally positive. These steadier ETF inflows signal continued institutional accumulation. (A handful of crypto-native traders likely drove the Oct selloff, not big institutions.)
Regulatory & Macro News: Globally, crypto regulation is evolving. The U.S. SEC recently approved streamlined ETF rules (generic listing standards), paving the way for many new crypto ETFs (e.g. Solana, XRP, Cardano funds) in Q4. Hong Kong’s regulator greenlit the city’s first Solana spot ETF on Oct 22, underscoring growing mainstream acceptance (JPMorgan sees ~$1.5B inflows into such new ETFs in the first year). In Washington, crypto CEOs just met with Senate lawmakers on a bipartisan market-structure bill. The climate is one of cautious optimism: policy momentum and central-bank easing support a bullish case, but geopolitical and fiscal uncertainties (e.g. U.S.-China trade, government shutdown) keep volatility high.
Outlook
Bitcoin’s technicals are improving: a 50-day MA breakout and bullish MACD signal counterbalance the lingering overhead supply. Support around $107K–$110K has held, while resistance at ~$120K–$125K looms. A sustained rally would require clearing these highs (plus closing the gap near $119K). Fundamentally, a dovish Fed outlook, healthy on-chain activity, and continued ETF investment provide tailwinds. Sentiment is mixed: short-term fear/oversold indicators hint at a relief bounce, but broader indicators (Ichimoku cloud, trend gauges) counsel caution in the near term. In sum, BTC appears to be in a mid-cycle consolidation rather than a decisive top or new bear phase.
Key takeaways: Bitcoin is rebounding from mid-Oct lows, clearing short-term moving averages (50DMA). The chart shows a potential double-bottom around $106K–$108K, with resistance ahead at ~$120K–$125K. Macro tailwinds (falling inflation, Fed cuts, US-China trade détente) bolster the bull case. On-chain health (all-time-high hash rate, rising active addresses) and steady ETF flows underline continued structural demand. Cautious investors should watch if BTC can sustain above $115K and especially overcome the $120K zone; a failure to break higher may keep it range-bound around $110K.
Here is a well-researched prediction for BTC/USD (Bitcoin/US Dollar) for November 2025, incorporating model-based estimates, market sentiment, and technical forecast:
Bitcoin Price Outlook: November 2025
Technical Analysis: As of late October 2025, Bitcoin trades around $115k with bullish near-term momentum. Most short-term indicators—such as moving averages—are positioned below price, and technical models lean positive. Key support lies near $110–113k and resistance around $112–113k, the upper bound of its recent consolidation range. RSI is neutral (~49), and MACD is flat, suggesting neither overbought nor oversold extremes. Overall, the chart favors an uptrend but still faces overhead supply just above current levels.
On-Chain Metrics: Blockchain data remains broadly supportive but shows signs of caution. Network hashrate and difficulty are near all-time highs, reflecting strong network security. However, miner sales have increased—transfer volumes to exchanges jumped in October—indicating pressure to monetize amidst rising costs. Around 95% of Bitcoin supply is currently in profit, so few coins are underwater. Institutional custody is expanding, with ETFs and exchanges now holding a significant portion of total supply. These dynamics suggest long-term accumulation is ongoing, though near-term miner and exchange selling could cap upside without fresh demand.
Macro Context: The macro backdrop leans slightly bullish. U.S. inflation has cooled, and markets expect a 25bps Fed rate cut at the end of October, adding to risk-on sentiment. Meanwhile, other central banks like the ECB have paused further hikes. Forecasts indicate the Fed funds rate could fall toward 3.5–3.75% by year-end. Historically, Bitcoin benefits from global liquidity growth and falling real yields. Still, the market remains vulnerable to geopolitical shocks or unexpected central bank hawkishness.
Institutional & ETF Flows: Institutional demand continues to be a strong tailwind. October’s rally to $125k was driven by massive spot ETF inflows, which now account for a sizable percentage of Bitcoin’s circulating supply. For instance, over $1 billion flowed into ETFs in a single week earlier this month. However, that momentum is fragile—late October saw a sharp reversal, with over $200 million exiting in a single session. Futures open interest has declined, and the options market is increasingly dominant, suggesting caution and lower leverage. Any weakening in ETF flows could weigh heavily on BTC price action.
Market Sentiment: Investor sentiment has improved but remains cautious. The Crypto Fear & Greed Index recently shifted from fear to neutral. Spot and futures selling pressure has eased, and funding rates are flat to slightly negative—indicating low speculative leverage. Retail and social activity have picked up in response to positive news, but the market has not flipped into euphoria. Momentum indicators like OBV and RSI show signs of fatigue but are not flashing major red flags. Overall, sentiment is stable and waiting for confirmation of the next move.
Scenarios & Price Ranges
Base Case (Moderate Bullish): Bitcoin is likely to trade between $110k and $130k throughout November. The $110–112k support range should hold if macro trends and ETF flows remain stable. Resistance around $125–130k could be tested again. This scenario assumes continued Fed dovishness, steady institutional buying, and moderate on-chain accumulation.
Bullish Case: If ETF inflows accelerate beyond current levels and macro conditions remain favourable (e.g., Fed cuts confirmed, geopolitical tensions ease), BTC could break above $130k and move toward $150k. This outcome would require a sustained influx of demand and a breakout beyond its all-time highs.
Bearish Case: If ETF flows reverse, regulatory setbacks occur, or macro shocks spook markets, BTC could break below $110k and test the $90–100k range. A break below $107k would likely trigger further downside. Increased miner selling and risk-off sentiment would contribute to this move.
Most Probable Range: Under current conditions, Bitcoin is most likely to trade between $110k and $130k during November. Upside breakouts or downside violations depend on major shifts in liquidity, ETF momentum, and risk sentiment. 1. Consensus Price Forecasts for November 2025
Most model-driven forecasters and crypto analysis platforms expect BTC/USD to trade between $111,000 and $135,800, with the average price range for the month around $121,000–$124,000. The minimum expected price is $111,147, while the maximum could approach $135,846 during moments of
Some platforms such as Changelly specify a tighter range for November: minimum $117,201, average $120,837, and maximum $124,473.
A few bullish analysts, referencing technical and cycle models, foresee possible attempts at new all-time highs (ATH) above $136,000, especially if global market momentum picks up.
2. Technical & Sentiment Insights
Technical indicators such as relative strength index (RSI near 65 in late October), upward-trending moving averages, and record open interest in options support a continued bullish to consolidating market structure, with intermittent pullbacks possible if macro risks (e.g., Fed policy shifts)
In the absence of fresh bullish catalysts, Bitcoin may consolidate around the 20-day and 50-day averages, possibly dipping briefly to $106,000–$109,700 before another leg up.
Institutional interest (ETF inflows, expanding derivatives markets, accumulation by whales) is expected to underpin the floor price, limiting the depth of any corrections.
3. Macro and Event Risk
Bullish scenarios for November hinge on:
Further weakening of the US dollar
Sustained global inflation hedging
Clear Fed policy direction (supporting risk-on assets)
Downside risk remains if the Federal Reserve surprises markets with a hawkish stance or if there are adverse regulatory or geopolitical shocks, which could briefly push BTC down toward $100,000 before
4. Outlier & Bold Predictions
Some high-profile traders project a new all-time high for BTC in November, with forecasts driven by momentum trading and strong inflows into spot Bitcoin
Exceptionally optimistic predictions cite price targets up to $180,000 by year-end in extreme bull case scenarios, though consensus remains lower for November
Summary Table: November 2025 BTC/USD Forecast
Source/Model
Min ($)
Avg ($)
Max ($)
Commentary
Changelly
117,201
120,837
124,473
Model-based, moderate bullish
TradersUnion
111,147
123,497
135,846
Technical, rangebound highs
CoinCodex/Longforecast
~113,300
120,975
136,966
4-model composite
Bold Analysts
121,000
—
136,000+
If sharp breakout/ATH
AI Model (Finbold)
109,700
—
~124,000
AI, flat to slight bullish
Conclusion
Base scenario: Bitcoin likely ranges between $115,000 and $125,000 for much of November, with temporary dips possible to $110,000 and surges toward $130,000 or more during high-volume periods.
Upside: A surge to new ATHs above $135,000 cannot be ruled out if risk appetite reignites strongly.
Downside: Sharp corrections below $110,000 are possible, but strong institutional support likely keeps the overall trend intact.
Disclaimer: This analysis is for informational and educational purposes only and does not constitute financial advice. All content reflects the author’s views as of October 2025 and relies on cited sources; always perform your own research before making investment decisions.