Technical Probability Metrix

Technical Probability Metrix — Study Material
To access Tradingview Indicator for FREE Click Here

This document explains, in plain language, what each block of the script does, how the indicators are calculated, and how to read the on-chart dashboard. Use it to learn—not to replace your own analysis or risk management.


1) What this script is designed to do

Goal: combine multiple classic indicators (RSI, MACD, Stochastic, Volume, VWAP, EMA cross, simple Order-Block band, trend structure, pivots, and Fibonacci context) into:

  • a composite trend/probability score
  • a clean horizontal dashboard table (status, values, strengths, probabilities)
  • alerts for major state changes

It is an overlay study (draws on price chart) and is timeframe-agnostic, with one cross-check on the 15-minute chart for EMA(9/20).


2) Inputs & configuration

All inputs appear in TradingView’s SettingsInputs and are grouped for clarity.

Elliott Wave (pivot scaffolding)

  • Wave Detection Period (wavePeriod): bars on each side of a pivot. Higher = fewer but stronger pivots.
  • Show Wave Labels/Lines (placeholders in this version): toggles for potential future labeling/lines.
  • Trend Lookback (trendLookback): length for structural trend checks (HH/HL, linreg slope, bar-up/down counts).

Fibonacci

  • Show Fibonacci Levels (style/color reserved here).
  • Fib Calculation Lookback (fibLookback): range used to define “swing high/low” context.

Technical Indicators

  • RSI Length: default 14.
  • MACD Fast/Slow/Signal: 12/26/9.
  • Stochastic Length: %K length (with %D = SMA(3) inside the code).
  • Volume MA Length: period for volume moving average and relative volume.
  • EMA 9/20 Periods: for fast/slow moving averages.

Display

  • Show Summary Table: toggles the on-chart dashboard.
  • Table Position & Size: choose where and how large.

Probability

  • Number of Probability Levels: number of “target steps” (probability ladder).
  • Adaptive Target Direction: if enabled, directs the ladder by detected trend.

Colors

Customization for bullish/bearish and Fibonacci tint.


3) Core calculations & signals

3.1 RSI

  • Formula: standard ta.rsi(close, rsiLength) (0–100).
  • Interpretation in script:
    • >70: Overbought (weighted negatively in score).
    • <30: Oversold (weighted positively).
    • Else: Neutral.

3.2 MACD

  • Formula: ta.macd(close, fast, slow, signal) → returns MACD line, Signal line, Histogram.
  • Signal logic:
    • Bullish when MACD > Signal and Histogram rising.
    • Bearish when MACD < Signal and Histogram falling.
  • Use: contributes ±1.5 to the composite score; histogram value shown in table.

3.3 Stochastic (%K/%D)

  • Formula: %K = ta.stoch(close, high, low, length); %D = SMA(%K, 3).
  • Signal logic:
    • Bullish when %K > %D and %K < 80 (up-turn within range).
    • Bearish when %K < %D and %K > 20 (down-turn within range).
  • Use: mild ±1 weight; value displayed and strength bar shown.

3.4 Volume analysis

  • Volume MA: ta.sma(volume, volumeLength).
  • Relative volume (volRatio): volume / volMA.
    • High volume: volRatio > 1.5 (context for conviction).
  • Use: if high volume and green candle → +1.5; if high volume and red → −1.5; else neutral.

3.5 VWAP

  • Value: ta.vwap(hlc3).
  • Signals:
    • Above VWAP: bullish (+1.5).
    • Below VWAP: bearish (−1.5).
  • Distance % also computed for strength bar: |close − vwap| / close * 100.

3.6 Simple Order-Block band (context proxy)

  • Window: highest high / lowest low over 20 bars.
  • Midline (obMid): average of band extremes.
  • Signals:
    • Close > obMid: bullish (+1).
    • Close < obMid: bearish (−1).
  • Strength %: where current price sits within the band.

Note: This is not a full institutional order-block model—just a mid-band context.

3.7 EMA(9/20) trend & 15-minute cross-check

  • On current chart: EMA(9) vs EMA(20) to get distance % (trend strength proxy).
  • On 15-minute timeframe (via request.security):
    • Bullish cross: EMA9_15 > EMA20_15 (+1.5).
    • Bearish cross: EMA9_15 < EMA20_15 (−1.5).
  • Why multi-TF: filters noise on lower TFs and adds confirmation on higher.

4) Composite Trend Model

4.1 Structure & momentum features

  • Price position within the trendLookback range.
  • Linear regression slope over trendLookback.
  • MA trend: SMA(20) vs SMA(50).
  • Swing structure: compares recent 20-bar HH/HL vs prior 20-bar HH/HL.
  • Bar dominance: counts up-bars vs down-bars across lookback.

4.2 TrendScore (cumulative)

  • Adds/subtracts points for:
    • Price position (top/bottom of lookback range),
    • LinReg slope sign,
    • MA(20/50) relationship,
    • Swing structure (HH+HL or LH+LL) with double weight,
    • Up-bar dominance.
  • Classification:
    • > +1 → Bullish trend
    • < −1 → Bearish trend
    • else → Neutral

This TrendScore also contributes ±1.5 into the totalScore separately (trendWeight) to reflect overall regime.


5) Pivot detection (Elliott-style scaffolding)

  • Purpose: capture recent significant highs/lows using ta.pivothigh/low with wavePeriod.
  • Saves the last ~14 highs and lows (values and their bar indexes).
  • Use here: not labeling Elliott waves, but used to compute wavePositionWeight:
    • Finds the most recent high/low pair and locates current price within that range.
    • If price sits in the lower 38.2% of that range → +2; between 38.2–61.8% → +1; above 61.8% → −1 (mean-reversion bias).

6) Fibonacci context

  • Pulls highest high / lowest low over fibLookback to understand the active swing.
  • Color options are provided; actual level plotting is minimal in this version.

7) Probability engine

7.1 TotalScore and base probability

  • TotalScore = sum of all component weights:
    • RSI, MACD, Stoch, Volume, VWAP, OB, EMA(15m), Wave position, and Trend regime.
  • Normalization: maps TotalScore to 0–100% via a maxScore (15) to create probabilityBase.

7.2 Individual indicator probabilities (for the table)

  • Each indicator also outputs its own probability (e.g., bullish MACD ≈ 70%, bearish ≈ 30%, neutral ≈ 50%).
  • The last column shows the Overall Probability (probabilityBase).

7.3 Target ladder (probability steps)

  • On the final bar, the script builds a ladder of numTargets probabilities that taper with distance.
  • Direction:
    • If Adaptive: follows the detected trend (bullish → up targets; bearish → down).
    • If not: direction depends on the sign of TotalScore.
  • The first target’s probability is also highlighted in the last column’s cells.

The ladder is a confidence heuristic, not a price target generator. It gives you a decaying probability as you aim further from current conditions.


8) The on-chart horizontal dashboard

The dashboard is a table with:

  • Title row
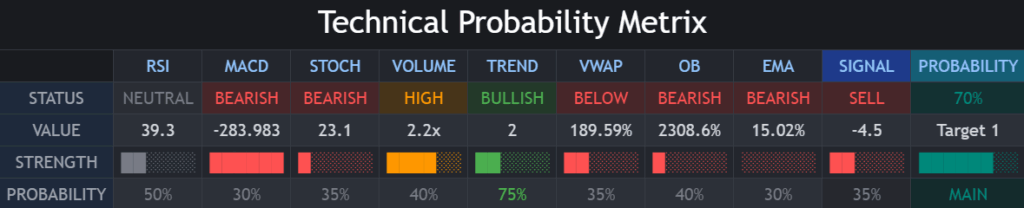
  • Headers: RSI, MACD, STOCH, VOLUME, TREND, VWAP, OB, EMA, SIGNAL, PROBABILITY
  • Row: STATUS
    Shows categorical status (e.g., OVERBOUGHT, BULLISH). Background/text colors follow bullish/bearish/neutral logic.
  • Row: VALUE
    Numerical readouts: RSI, MACD histogram, %K, Relative Volume (×), TrendScore, VWAP distance %, OB strength %, EMA distance %, and TotalScore.
  • Row: STRENGTH
    Text-based progress bars (█░) scaled to each metric’s natural range (e.g., RSI 0–100, VWAP distance cap 5%).
  • Row: PROBABILITY
    Per-indicator probability (%) with color emphasis when >70 (bullish) or <30 (bearish).
    The rightmost column shows the Main overall probability and a bar for the first target.

Reading tips

  • Think of the STATUS row as directional state, VALUE as magnitude, STRENGTH as confidence, and PROBABILITY as a decision helper.
  • Look for confluence: several green/bullish blocks + high overall probability + bullish TrendScore is stronger than one isolated signal.

9) Alerts included

The study raises alerts when:

  • Strong Buy: TotalScore > 5
  • Strong Sell: TotalScore < −5
  • Trend flips: transitions into bullish or bearish trend regime
  • EMA(9/20) 15-min crosses: bullish or bearish

Add these in TradingView’s Alerts panel after applying the indicator to a chart.


10) Practical usage & tips

  • Timeframes: The logic works on any chart; the EMA check consults 15-minute for an extra filter. If your main chart is 15m or higher, this acts as self-confirmation; if you’re on 1–5m, it acts like a higher-TF compass.
  • Markets: Works on crypto, equities, indices, FX, futures. For illiquid symbols, volume/OB context may be noisy.
  • TrendLookback tuning:
    • Scalpers: 50–75 to make the model more responsive.
    • Swing: 100–200 for smoother regime classification.
  • Volatility consideration: When VWAP distance and EMA distance bars are large, trends may be extended—this is good for trend-following but risky for late entries.
  • Mean-reversion cues: RSI oversold + wavePosition in the lower third + neutralizing MACD can be an early bounce setup—but wait for confirmation (e.g., EMA cross change or TrendScore improvement).
  • Confluence matters: Treat any single block as informational. Trade decisions should rely on multiple aligned signals + risk plan.

11) Limitations & what this script does not do

  • It does not mark institutional order-blocks, fair-value gaps, or full Elliott counts—only simplified contextual proxies.
  • Probabilities are heuristic (feature-weighted), not calibrated win-rate forecasts.
  • Repaints? Pivot functions confirm after wavePeriod bars; probabilities are computed on the last bar for the table. The EMA 15m check uses security() with default settings (no special bar merge tricks)—be mindful when mixing timeframes.
  • Backtest results (if you wrap this into a strategy) will depend heavily on your entry/exit rules and risk controls.

12) Quick checklist before using live

  1. Confirm trend regime (TrendScore row + STATUS).
  2. Check MACD/RSI/Stoch alignment.
  3. Look at Relative Volume and VWAP location.
  4. Confirm EMA(9/20) 15m bias agrees with your plan.
  5. Ensure overall probability is supportive (>60% for trend plays, for example).
  6. Size the trade with pre-defined stop, target, and max risk rules.

13) Glossary (fast refresher)

  • RSI: momentum oscillator; overbought/oversold zones.
  • MACD: trend-momentum, line/Signal cross and histogram slope.
  • Stochastic: momentum vs. recent range; %K/%D cross.
  • VWAP: volume-weighted mean price; intraday fair value anchor.
  • EMA: exponential MA; faster response than SMA.
  • Linear Regression Slope: directional drift estimate.
  • Relative Volume: current volume vs. average—conviction proxy.

14) aiTrendview Disclaimer

This indicator and its outputs are intended solely for education and research. They do not constitute financial, investment, or trading advice. Markets involve substantial risk, including the risk of loss. Past performance and on-chart probabilities are not guarantees of future results. You are responsible for your own decisions, position sizing, and risk management. aiTrendview, its contributors, and affiliates are not liable for any losses incurred from the use of this script or the information derived from it. Always validate signals with your own analysis and consult a licensed financial professional if needed.

Share this post :
Facebook
WhatsApp

Start To Invest And Earn More

Lorem ipsum dolor sit amet consectetur adipiscing elit dolor