


aiTrendview.com Fundamental Analysis – Study Material
To access Tradingview Indicator for FREE Click Here
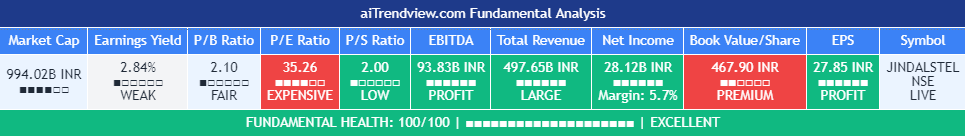
The aiTrendview.com Fundamental Analysis Table is a powerful tool designed to give traders and investors a quick, comprehensive overview of a company’s financial health. This horizontal, color-coded table includes live financial data, progress indicators, and smart health insights for informed decision-making. Below are the key financial metrics included in the table:
________________________________________
1. Market Capitalization (Market Cap)
Definition: Market Cap is calculated as the total number of outstanding shares multiplied by the current stock price. Importance: This gives investors an idea of the company’s size and valuation.
How to Use:
• Large-cap stocks (> $10B) are typically stable, established companies.
• Small- or mid-cap stocks may offer higher growth but come with more volatility.
aiTrendview Feature: Progress bars visually represent the company’s size. This helps users quickly gauge whether the stock is a micro-cap, mid-cap, or large-cap investment opportunity.
2. Earnings Yield (%)
Definition: Earnings Yield = (EPS / Price) × 100. It shows how much a company earns relative to its stock price. Importance: It’s the inverse of the P/E ratio and is used to compare returns from equity with bond yields.
How to Use:
• A yield > 10% may indicate undervaluation.
• Lower yield (< 3%) may indicate an overpriced stock.
aiTrendview Feature: Health indicators like “STRONG”, “FAIR”, or “POOR” and a progress bar help investors assess return potential relative to risk.
3. Price-to-Book Ratio (P/B Ratio)
Definition: P/B Ratio = Market Price / Book Value per Share.
Importance: Measures market valuation relative to the company’s net assets.
How to Use:
• A ratio < 1 can mean the stock is undervalued.
• 3 might indicate overvaluation unless justified by high ROE.
aiTrendview Feature: Color-coded health markers show if the company is UNDERVALUED, FAIR, or OVERVALUED, making valuation analysis visual.
4. Price-to-Earnings Ratio (P/E Ratio)
Definition: P/E = Price / Earnings per Share. It tells you how much investors are paying for each unit of earnings. Importance: One of the most commonly used valuation metrics.
How to Use:
• A low P/E (< 15) might indicate undervaluation.
• High P/E (> 30) could mean overvaluation or growth expectations.
aiTrendview Feature: The health indicator (“CHEAP”, “FAIR”, “HIGH”, “EXPENSIVE”) with a visual bar helps judge sentiment and valuation instantly.
5. Price-to-Sales Ratio (P/S Ratio)
Definition: Market Cap / Revenue. Indicates how much investors pay per dollar of sales.
Importance: Useful for valuing companies with low or negative earnings.
How to Use:
• < 2 is attractive in most industries.
• Higher ratios need to be justified by strong growth.
aiTrendview Feature: P/S-based health tags and progress bars help traders decide whether the stock is reasonably priced on revenue.
6. EBITDA (Earnings Before Interest, Taxes, Depreciation & Amortization)
Definition: A measure of a company’s core operational profitability.
Importance: Strips out non-operational costs and is used for comparative analysis.
How to Use:
• Positive EBITDA suggests financial strength.
• Compare year-over-year for growth consistency.
aiTrendview Feature: Visual score and health indicator classify profitability status as “PROFIT” or “LOSS”.
7. Total Revenue
Definition: The total income from sales before expenses.
Importance: Indicates the scale of business operations.
How to Use:
• Rising revenue over quarters = growth.
• Compare with competitors for market share insight.
aiTrendview Feature: Categorizes revenue scale as “MICRO”, “SMALL”, “MEDIUM”, or “LARGE” – useful for gauging company tier.
________________________________________
8. Net Income
Definition: Profit after all expenses, taxes, and interest.
Importance: Shows the company’s actual profitability.
How to Use:
• Positive Net Income = healthy bottom line.
• Use for EPS and ROE calculations.
aiTrendview Feature: Margin percentage + status label (“PROFIT” or “LOSS”) instantly convey financial strength.
________________________________________
9. Book Value Per Share (BVPS)
Definition: Total equity divided by the number of outstanding shares.
Importance: Indicates the liquidation value per share.
How to Use:
• Compare with current market price.
• Price < BVPS can mean undervaluation.
aiTrendview Feature: Shows whether the stock is trading at “DISCOUNT” or “PREMIUM” to its actual value.
________________________________________
10. Earnings Per Share (EPS)
Definition: Net income divided by outstanding shares.
Importance: Measures profitability on a per-share basis.
How to Use:
• Key input for valuation and dividend decisions.
• Positive EPS is essential for investment appeal.
aiTrendview Feature: Labeled “PROFIT” or “LOSS” and enhanced with visual status for clarity.
________________________________________
11. Symbol & Exchange Info
Definition: Displays the trading symbol and exchange (e.g., NSE, NYSE).
Importance: Ensures clarity when analyzing or sharing screenshots.
How to Use:
• Useful for verifying ticker and confirming data source.
aiTrendview Feature: Clearly displayed with “LIVE” tag for credibility.
________________________________________
12. Fundamental Health Score
Definition: aiTrendview computes a composite score (0–100) based on 5 core metrics: Net Income, EPS, P/E, P/B, and EBITDA.
Importance: Provides a single summary score to assess the company’s overall financial strength.
How to Use:
• Use this as a filter to shortlist strong candidates.
• Score > 80 = “EXCELLENT”; 60–80 = “GOOD”; < 40 = “POOR”.
aiTrendview Feature: A professional horizontal progress bar with color-coded grade makes it visually intuitive.
________________________________________
⚠️ Disclaimer from aiTrendview.com
The information provided in this Fundamental Analysis dashboard is for educational and informational purposes only. While the data is sourced live and computed dynamically, it should not be interpreted as investment advice. Traders and investors must do their own due diligence and consider risk appetite, macroeconomic factors, and other indicators before making any financial decisions. aiTrendview.com or its affiliates shall not be held liable for any loss arising from the use of this tool. Markets are risky — trade wisely and responsibly.


